Introduction
This paper looks at the recent performance of FHA mortgages and focuses on the reasons given by borrowers who have become seriously delinquent (D90+) for becoming so. The findings indicate a consistent pattern that is developing between trends in the above-mentioned reasons and in the overall job market. This pattern is concerning and deserving of further tracking.
Brief Description of FHA
The Federal Housing Administration (FHA), a federal agency that is part of the Department of Housing and Urban Development (HUD), provides mortgage insurance backed by the federal government with the goal of making homeownership accessible to more Americans, particularly low-to-moderate-income borrowers who may not qualify for conventional loans. FHA loans allow down payments as low as 3.5% and lower credit scores than conventional loans, making them particularly attractive for first-time home buyers who tend to have low to moderate income or less-than-perfect credit.
Characteristics of FHA borrowers
1. Most FHA loans are taken to purchase a home (vs refinancing)
As seen in Figure 1, nearly 80% of FHA loans made in 2023 are for purchase mortgages (i.e., are taken out for the purpose of purchasing a home), and even during the high refinance years for 2020-2022, this percentage was around 60% – 70%. By way of comparison, during 2021, 2022, and 2023, the purchase mortgages %’s for Fannie Mae (p.84) were 33%, 62%, and 86%, respectively, while for Freddie Mac (p.57), they were 35%, 63%, and 88% respectively. Essentially, GSE mortgages are more likely to refinance, and this can be seen during 2021 (high refinance year) and 2022 (high refinance first half).
2. FHA loans have high loan-to-value (LTV), i.e. make very low down payments
As seen in Figure 2, the average LTV of new purchase mortgages has been slightly over 95% except until recently, when it has dipped to around 95%. Refinances tend to have lower LTVs primarily due to house price appreciation from the time the earlier mortgage was taken out. As noted above, FHA loans allow down payments as low as 3.5% and this is an attractive feature for borrowers looking to buy their first home. In comparison, the average LTV of new loans for both Fannie Mae and Freddie Mac in 2023 was 78%.
3. FHA loans have lower-than-average credit quality
As seen in Figure 3, FHA borrowers taking out tend to have lower than average FICO scores. The FICO scores of new purchase loans have been in the 670-680 range since 2014. Figure 4 shows that the average FICO for all new FHA borrowers (purchase and refi) for 2021, 2022, and 2023 were 672, 664, and 670, respectively. By way of comparison, the weighted average FICOs for new business during 2021, 2022, and 2023 for Fannie Mae (p.83) were 756, 747, and 755, respectively, and for Freddie Mac (p.56), the corresponding values were 752, 746 and 753 respectively. Hence, the average credit scores for FHA borrowers are around 80-85 points lower than for GSE borrowers.
Figure 1

Source: FHA Annual Report to Congress Fiscal Year 2023 (p.45)
Figure 2
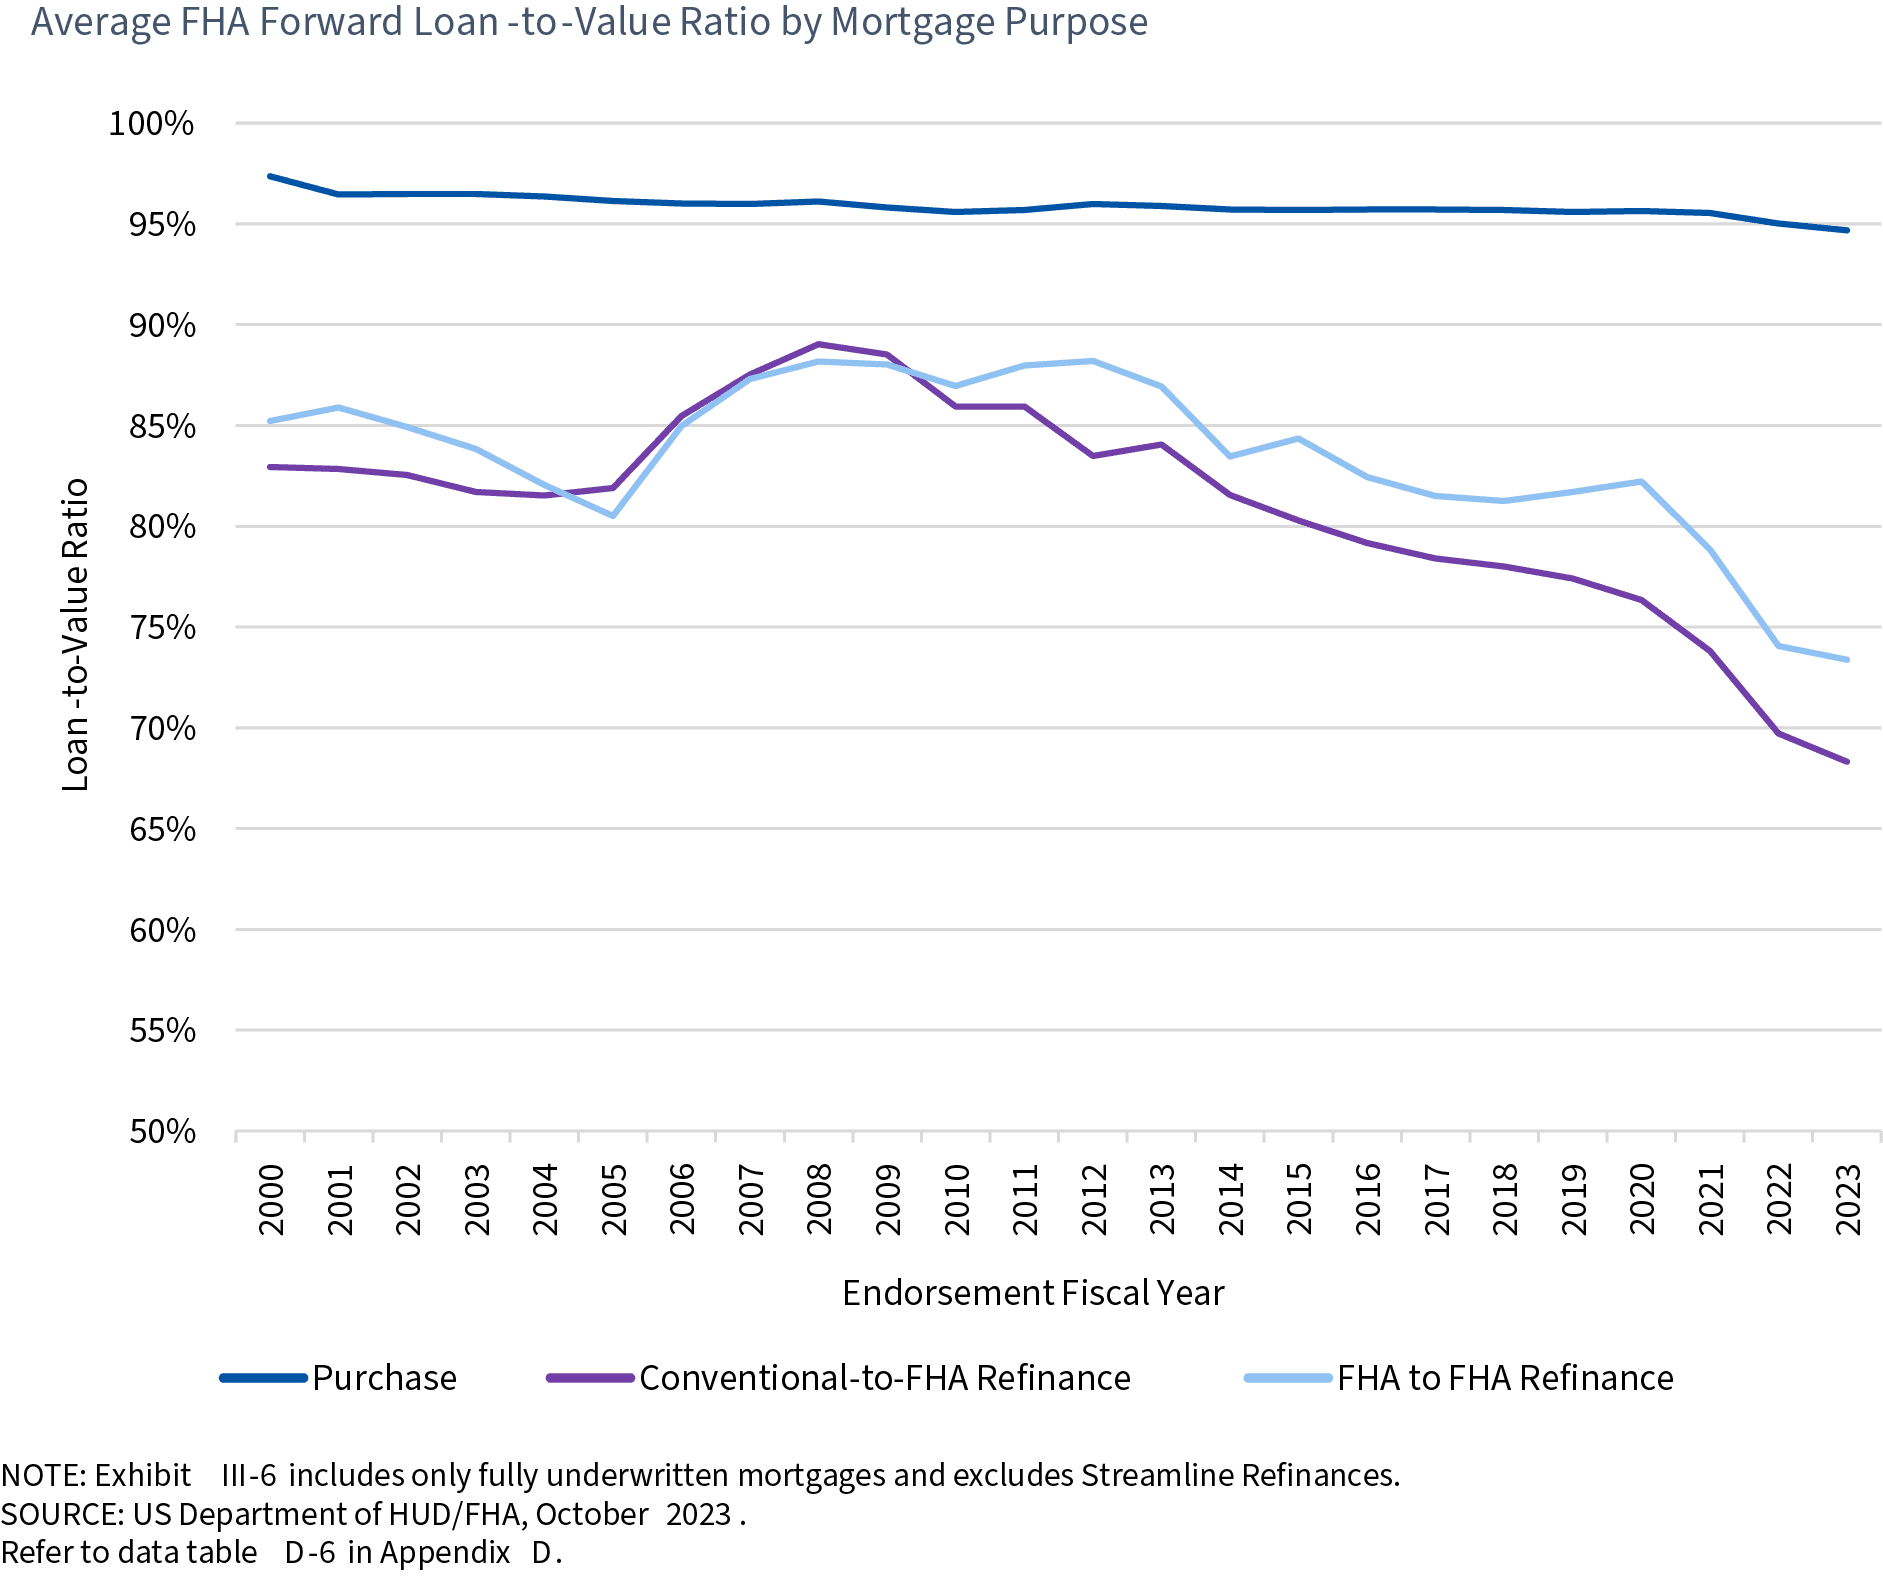
Source: FHA Annual Report to Congress Fiscal Year 2023 (p.47)
Figure 3
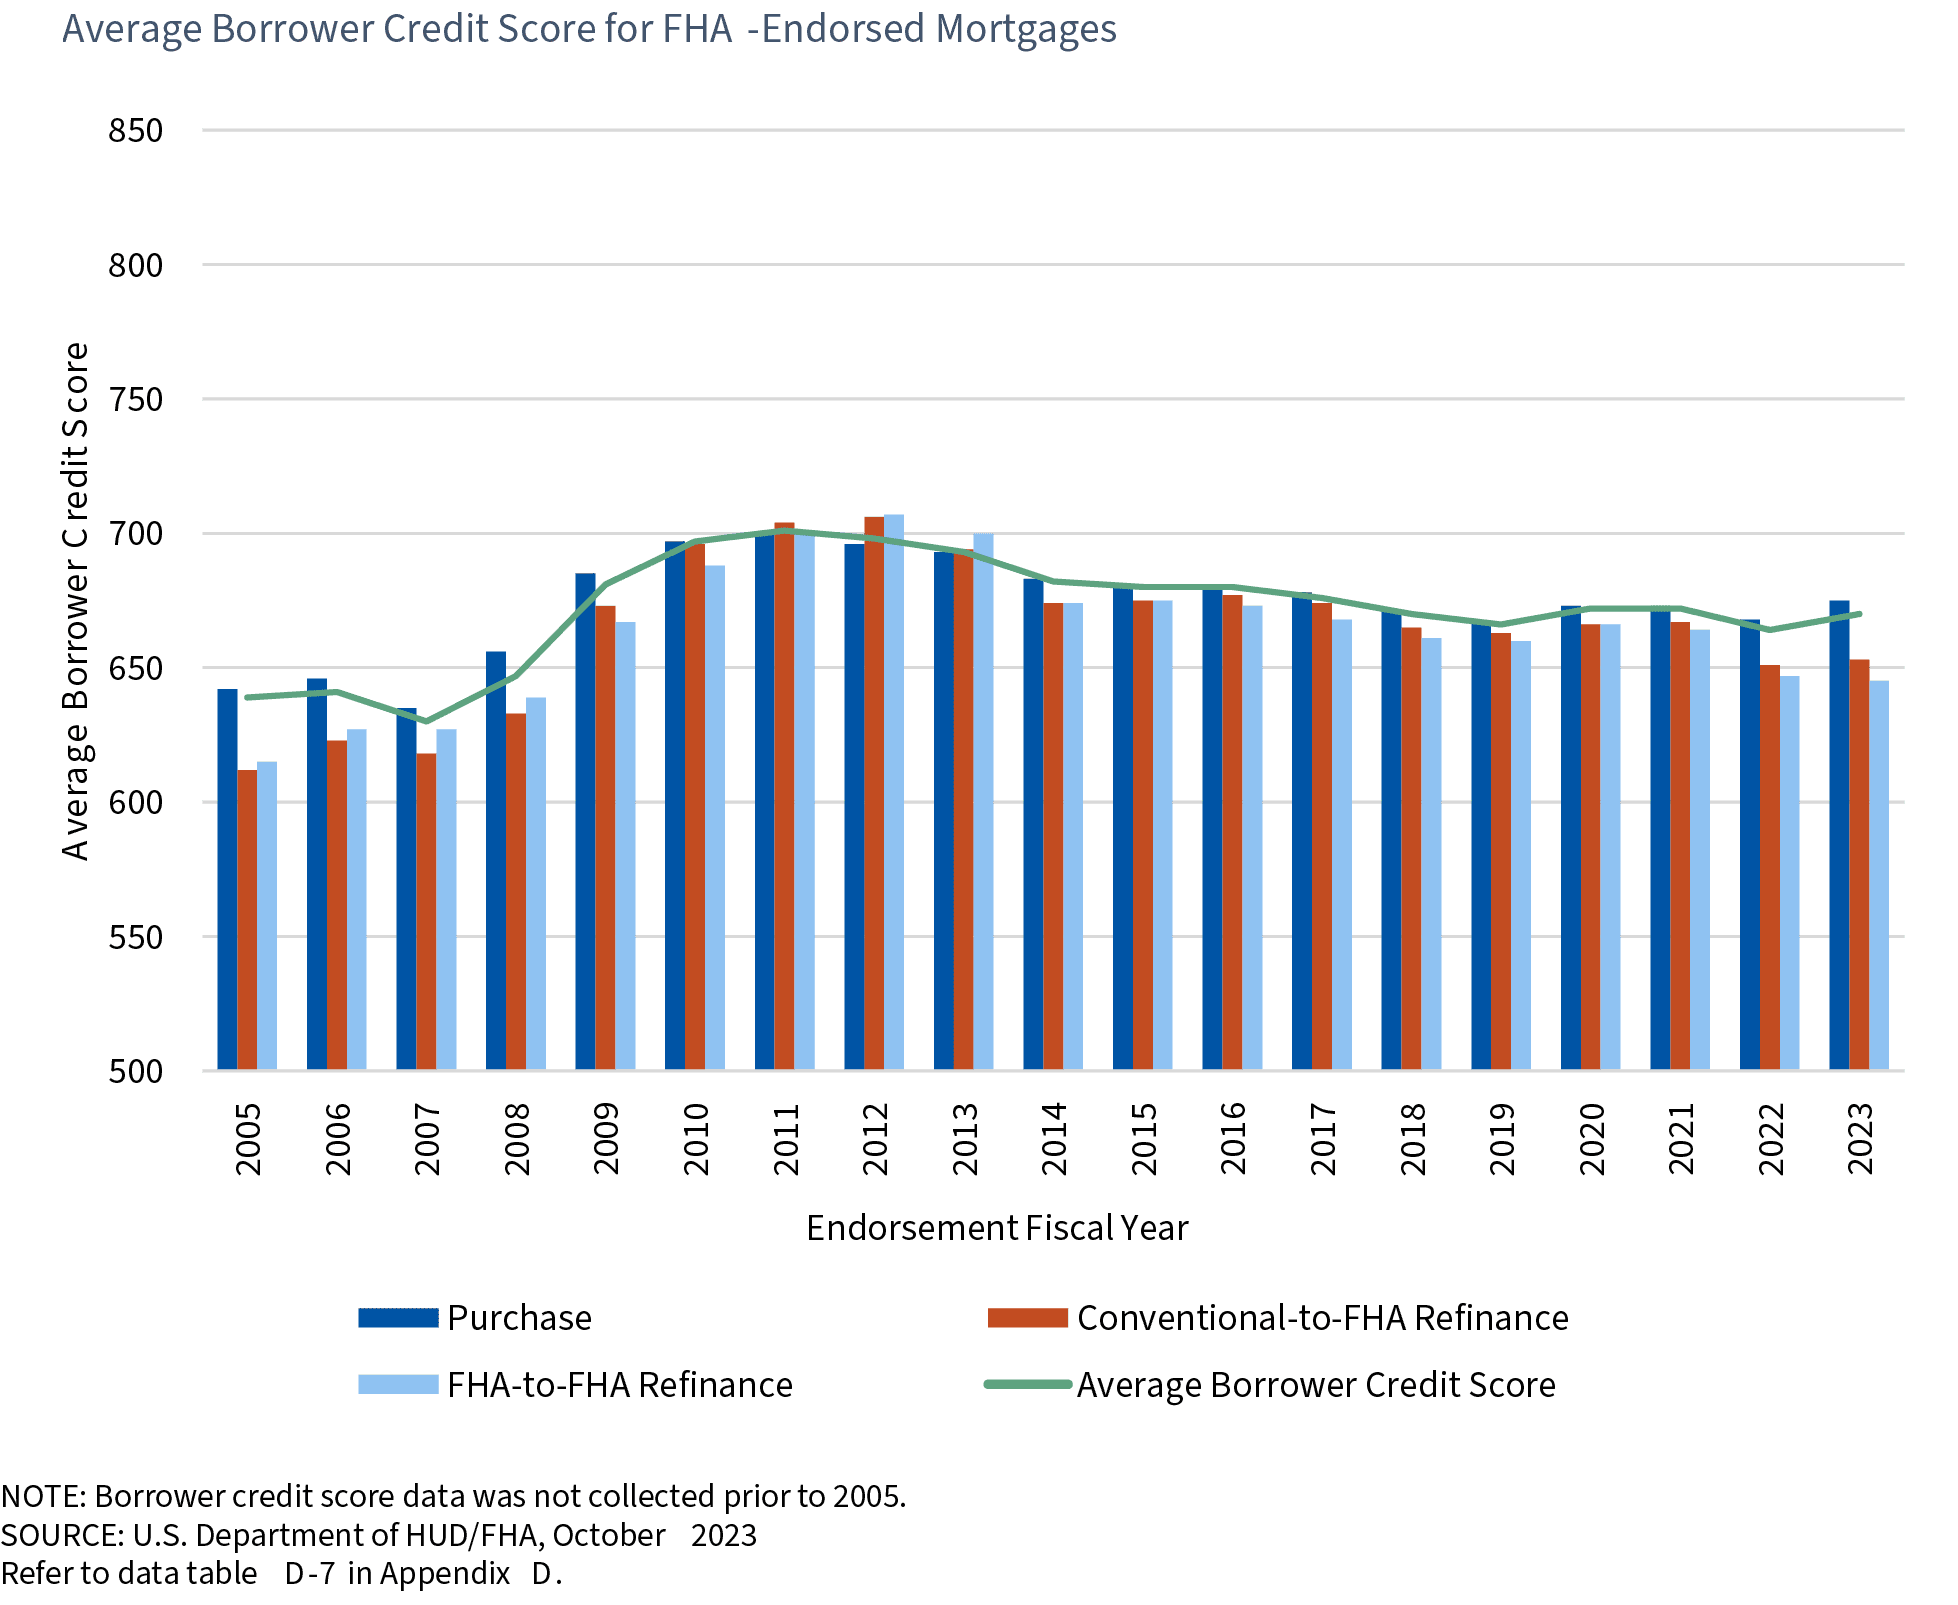
Source: FHA Annual Report to Congress Fiscal Year 2023 (p.48)
Figure 4

Source: FHA Annual Report to Congress Fiscal Year 2023 , p.19
4. FHA borrowers have greater indebtedness, i.e., higher Debt to Income (DTI) ratios
FHA borrowers tend to have higher debt-to-income (DTI) ratios than GSE borrowers. In 2023, the average DTI of new FHA purchase borrowers (Table D-9, p.106) was 45.10%, with 64% of borrowers having DTI > 43. As shown in Fig. 5, FHA’s mix of higher DTIs has been trending up consistently since 2015. By comparison, the average DTI of new 2023 borrowers (p.83) for Fannie Mae was 38%, with only 36% of borrowers having DTI > 43.
Figure 5

Source: FHA Annual Report to Congress Fiscal Year 2023, Table D-9, p.106
5. FHA borrowers are mostly first-time home buyers
FHA loans are particularly attractive for first-time home buyers due to the acceptance of low down payments, higher debt-to-income (DTI) ratios, and lower-than-average credit quality of the borrowers. Such borrowers tend to have limited savings and limited income and have also not had the opportunity to build a robust credit record. As shown in Figure 4, the percentage of first-time homebuyers as a fraction of all borrowers who are purchasing homes was 84.6%, 83.5%, and 82.2% for 2021, 2022, and 2023, respectively. Figure 6 shows that the first-time homebuyer share has historically been between 75% – 85%. By way of comparison, the first time homebuyer percentage for the rest of the market (including GSEs) has been slightly below 50% in recent years (Figure 7).
Figure 6
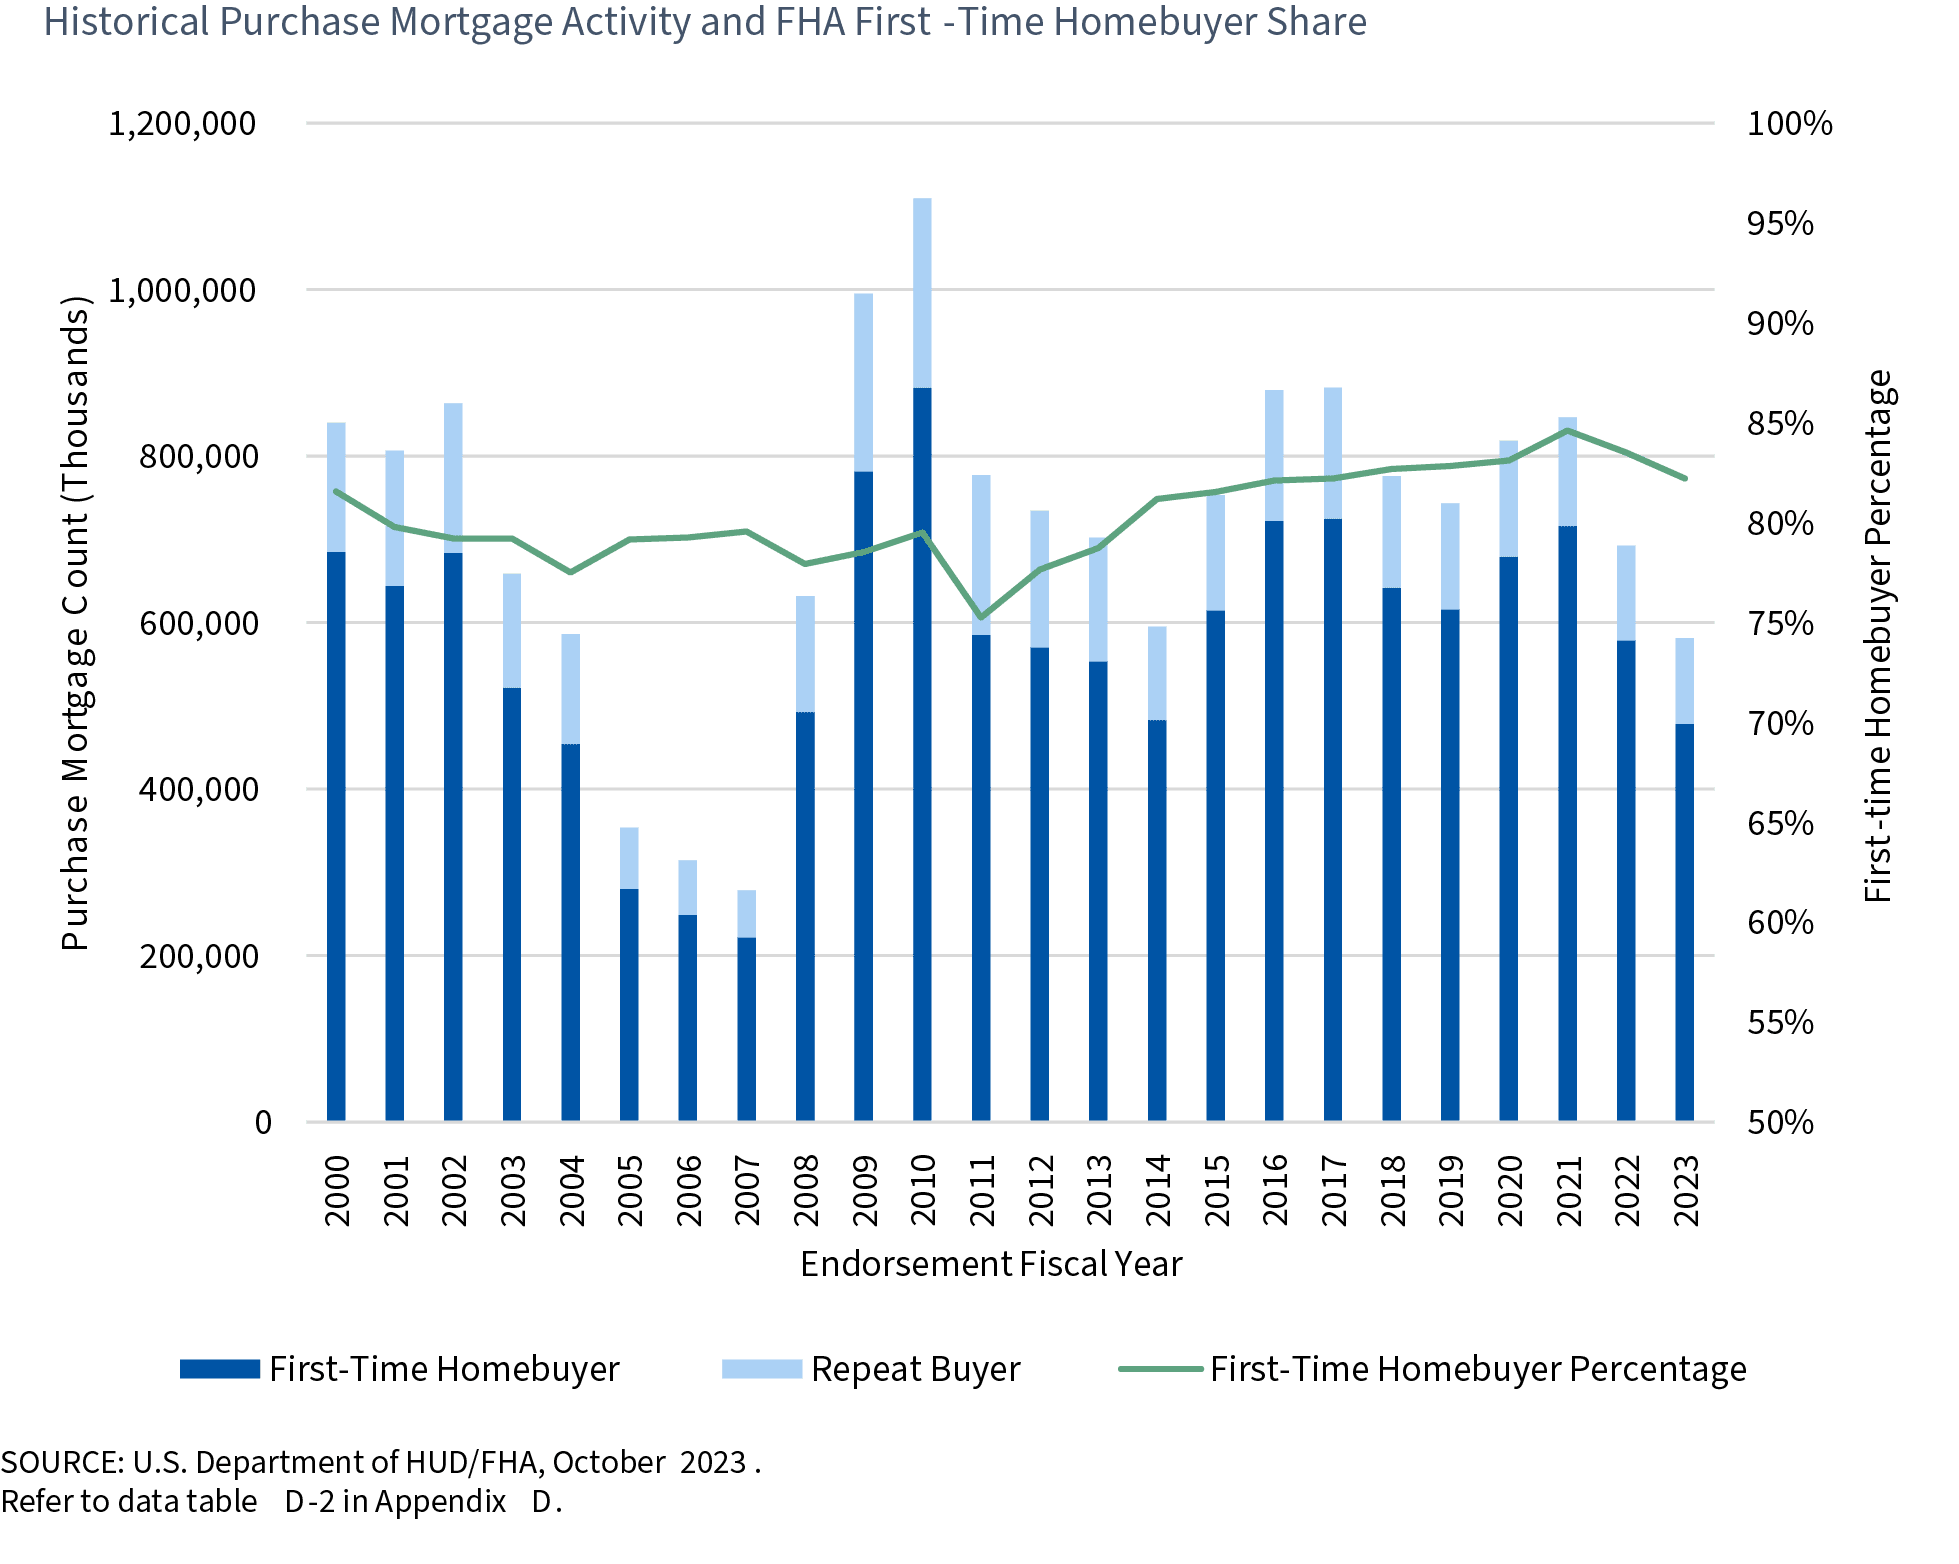
Source: FHA Annual Report to Congress Fiscal Year 2023 (p.43)
Figure 7

Source: FHA Annual Report to Congress Fiscal Year 2023 (p.7)
6. FHA borrowers tend to take out smaller loans (reflecting, in part, lower loan limits)
As shown in Figure 4, the average loan amount for new FHA loans was $239K, $260K, and $285K in 2021, 2022, and 2023, respectively. By comparison, the average loan amounts for new business during 2021, 2022, and 2023 for Fannie Mae (p.83) were $282K, $302K, and $321K, respectively, while for Freddie Mac (p.36), they were $288K, $300K and $314K respectively. The lower loan sizes for FHA borrowers likely reflect the higher mix of first-time homebuyers as well as the fact of lower loan limits (i.e., maximum loan size permitted) for FHA homes in most geographies. For example, the 2024 GSE and FHA loan limits for Philadelphia are $766,550 and $557,750 respectively.
In summary, compared to GSE borrowers, FHA borrowers tend to have worse credit, make very low down payments, take out smaller loans, and are more likely to be first-time home buyers.
Figs 8-9 further elaborate on this. Fig. 8 shows that the FHA accounts for around three-quarters of all loans made to first-time homebuyers with LTV > 95% and FICO < 680.
Figure 8

Source: FHA Annual Report to Congress Fiscal Year 2023 (p.8)
Figure 9
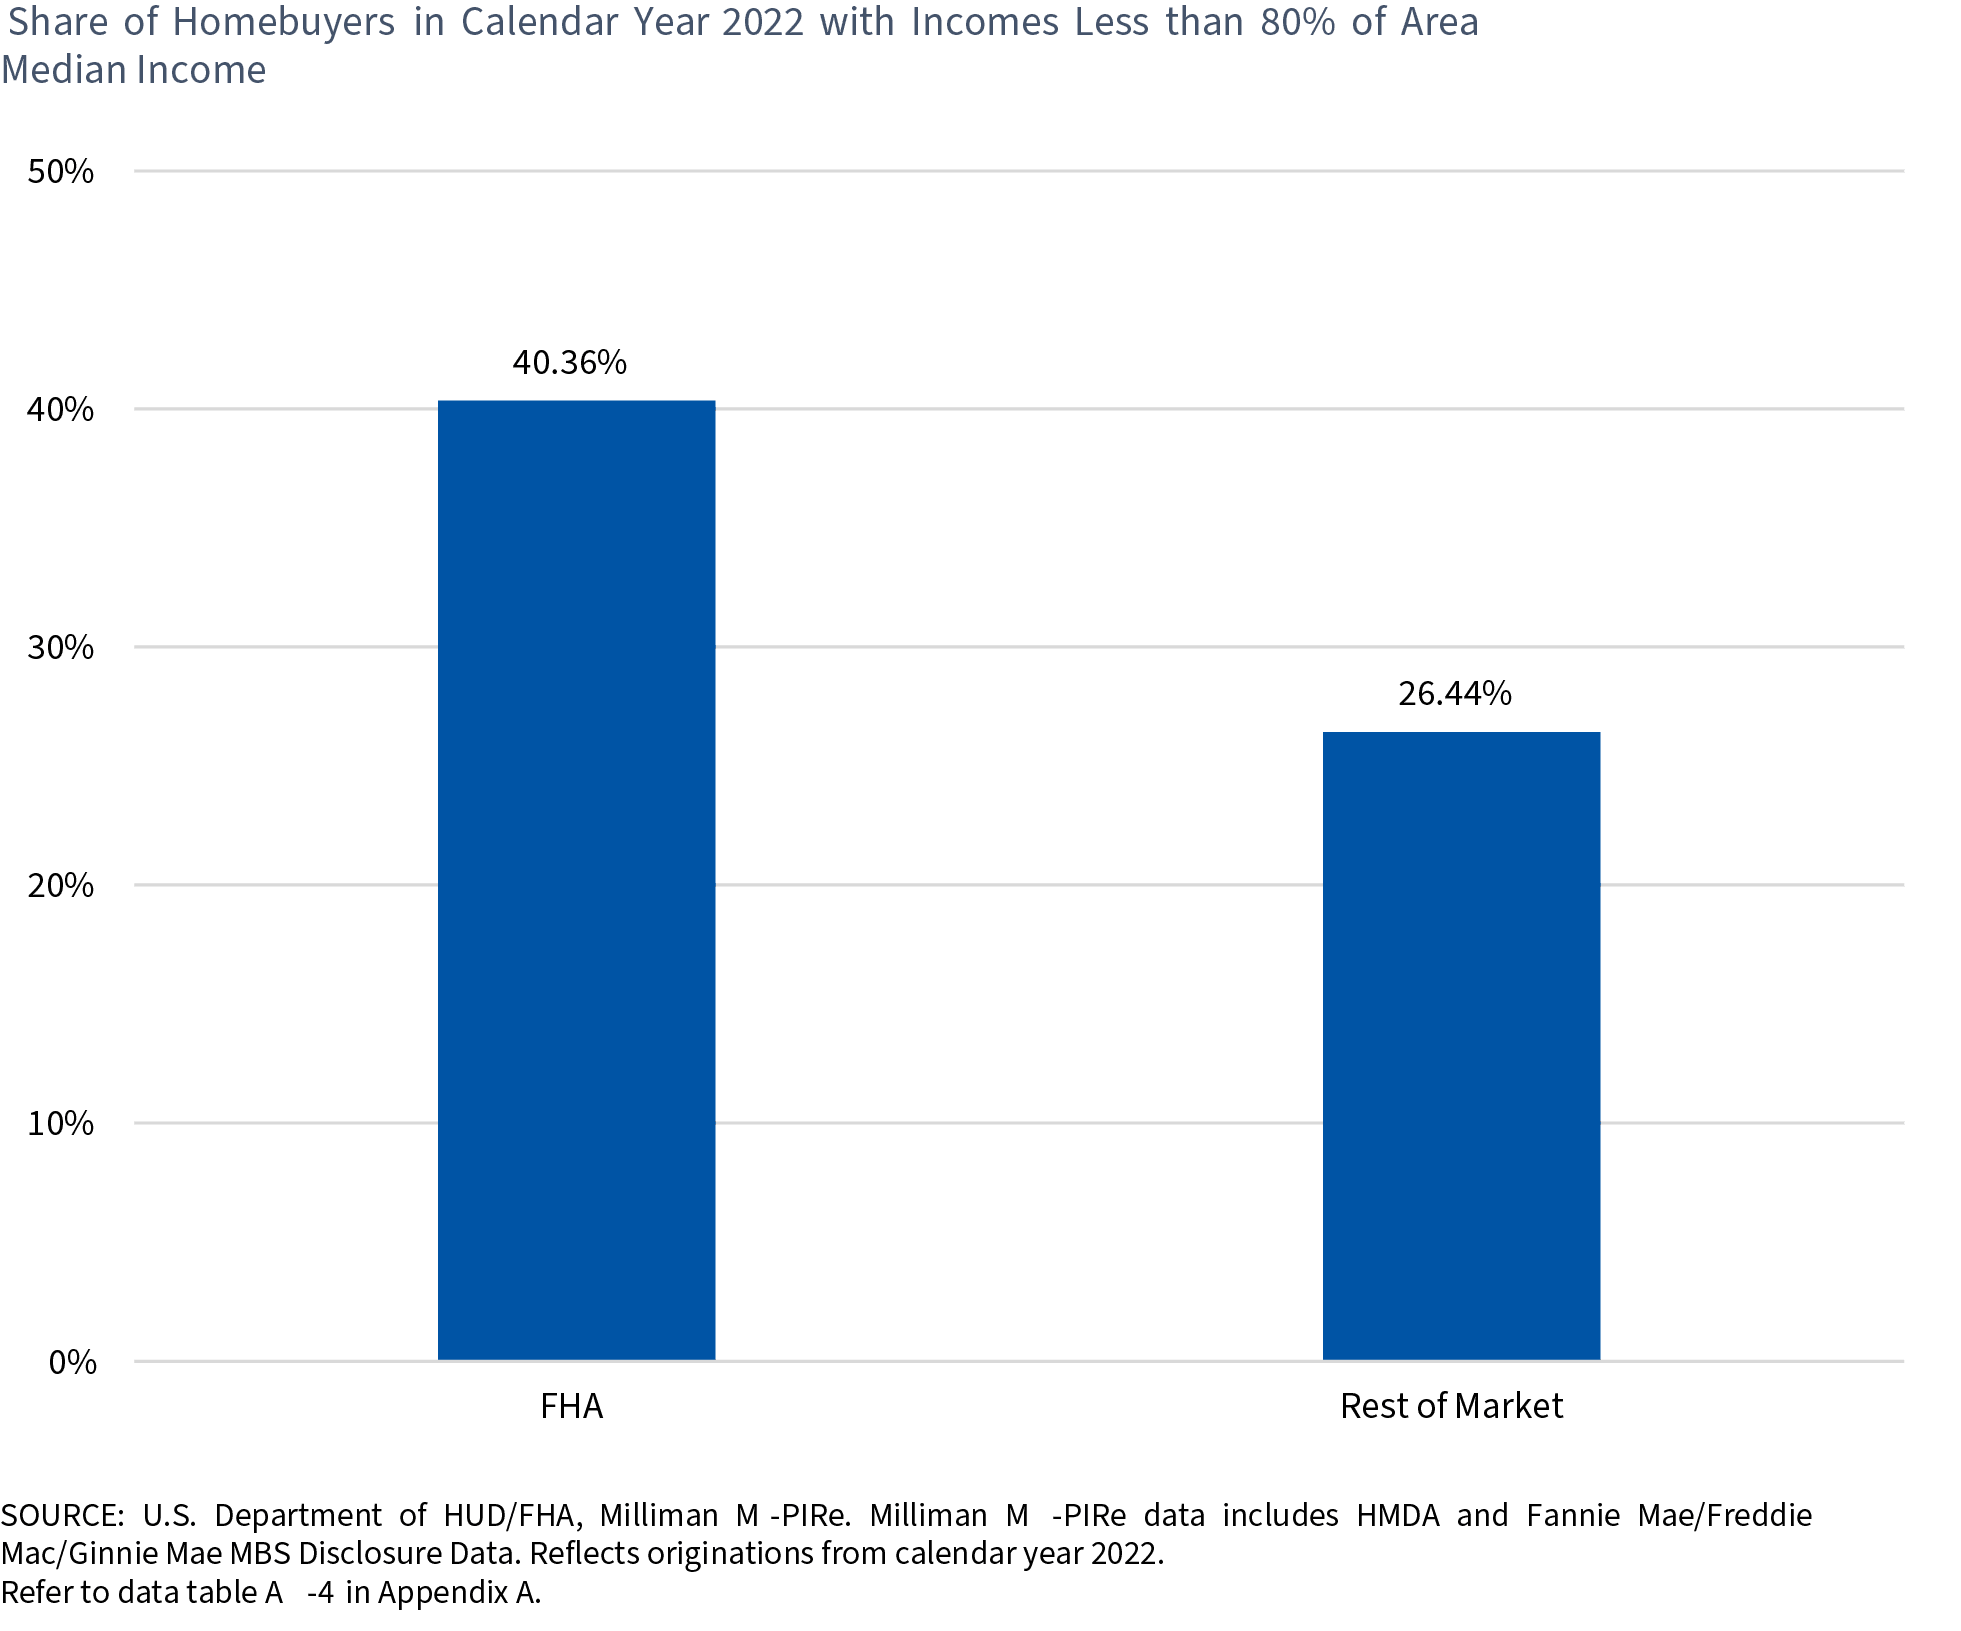
Source: FHA Annual Report to Congress Fiscal Year 2023 (p.10)
Fig. 9 shows that the FHA serves a higher percentage (40%) of low-income households than the rest of the market (26%).
FHA Credit Performance
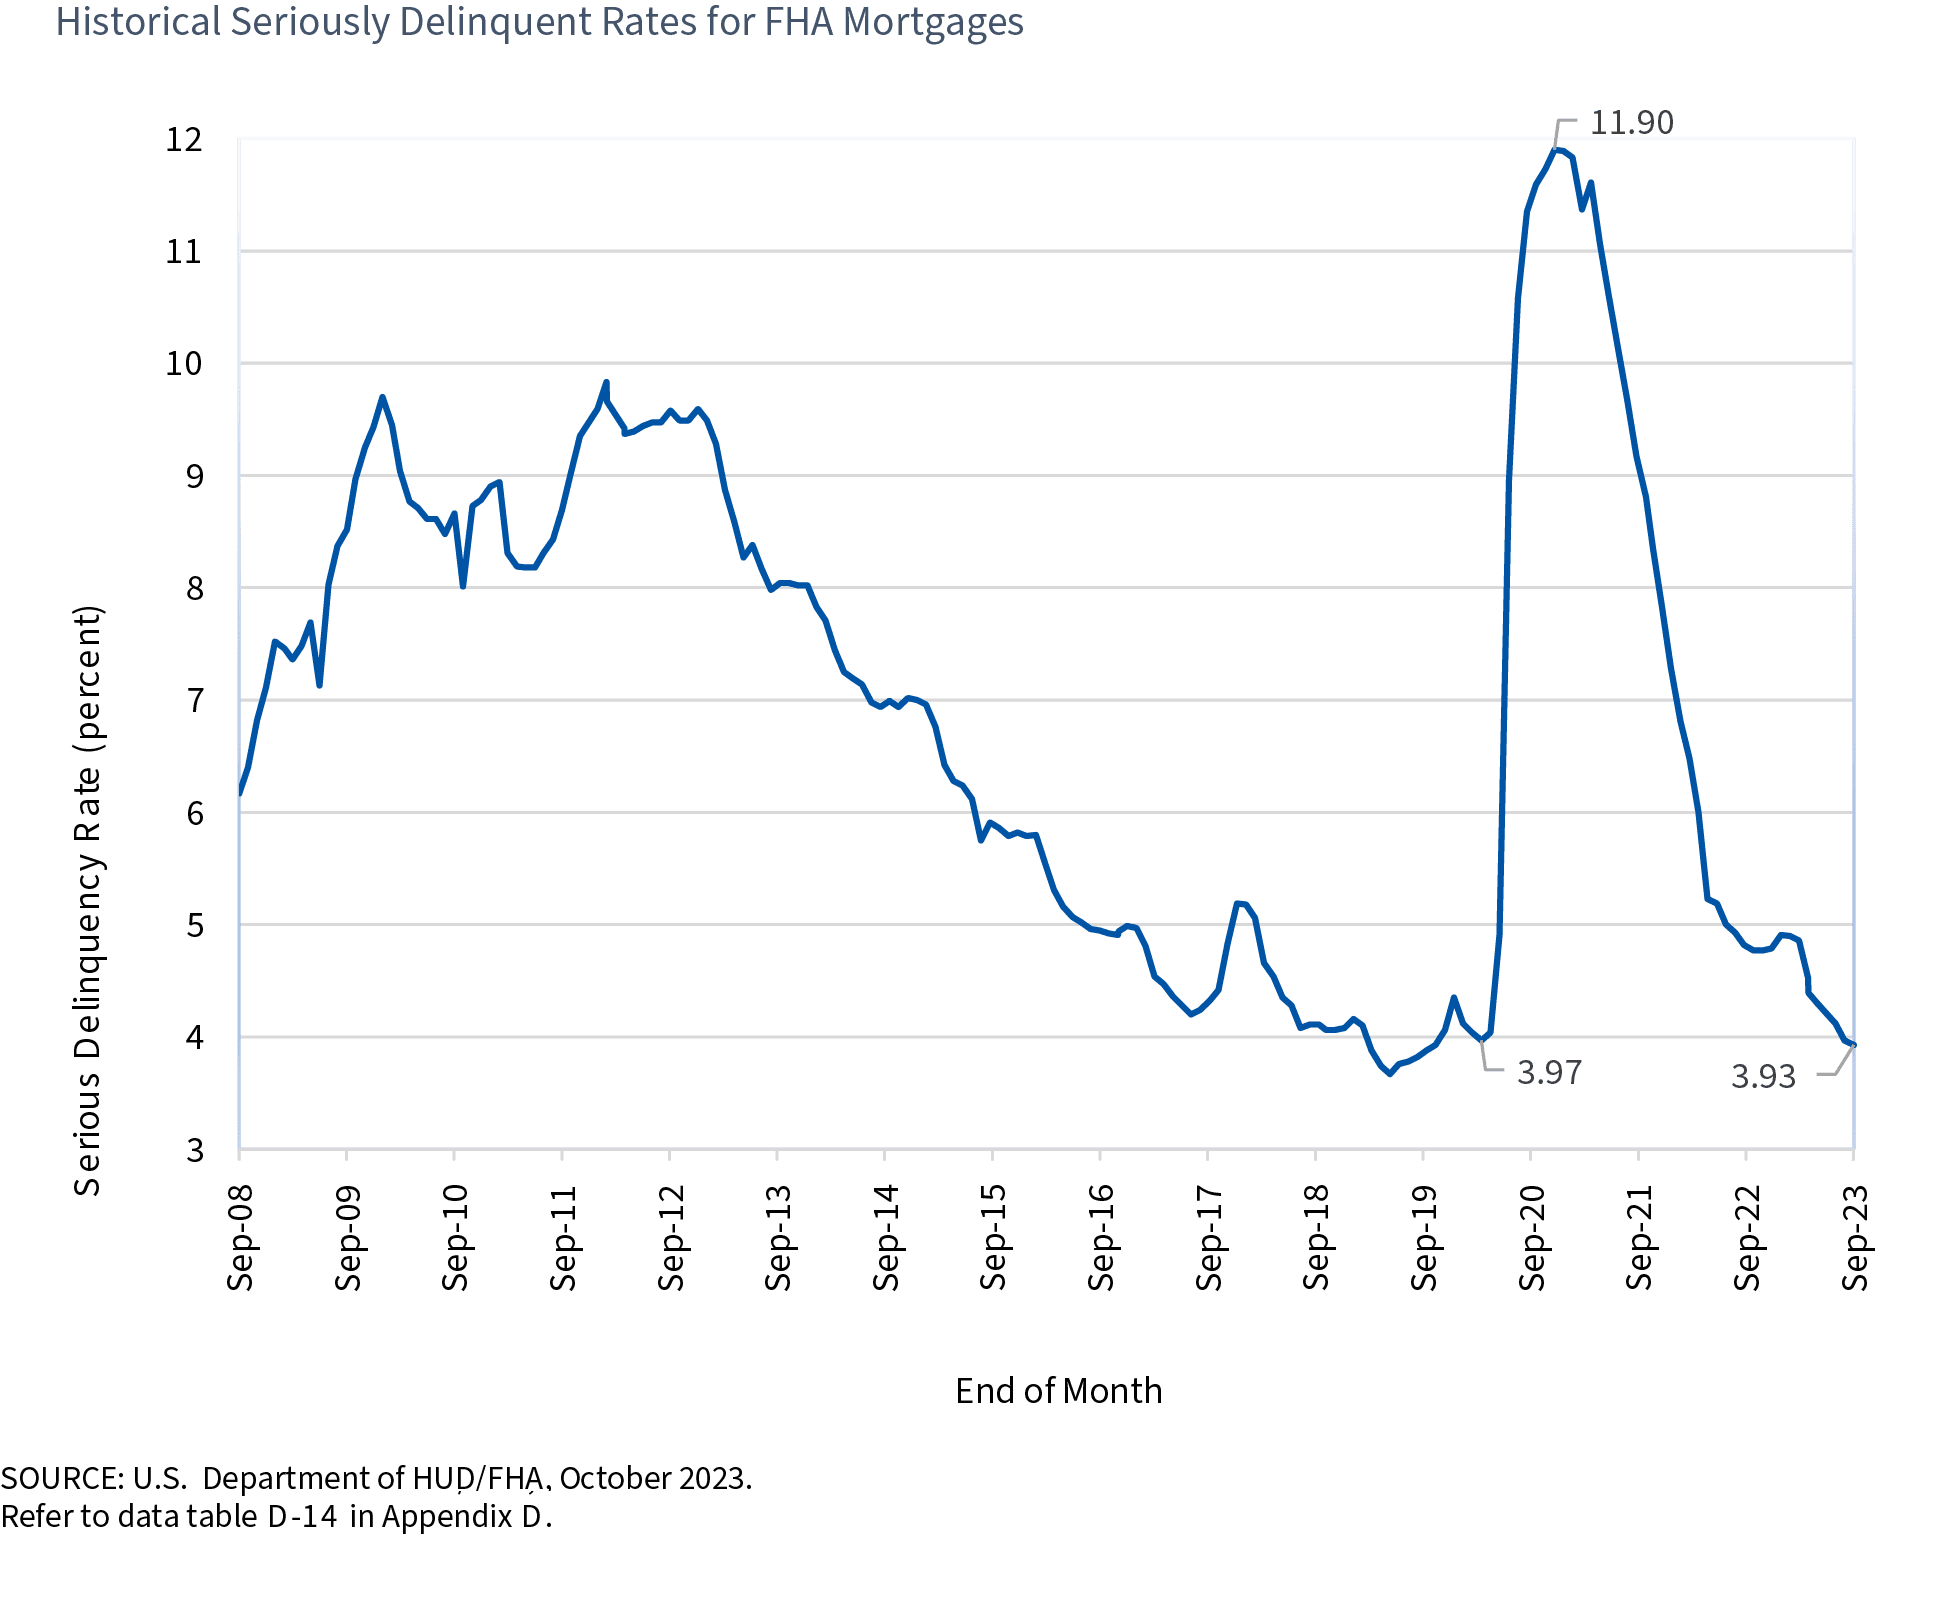
Fig. 10 shows the 30+ delinquency rates for different segments of the mortgage market over time as of Q2 2024. FHA delinquency rates, in general, are considerably higher than those of other segments, such as conventional or VA loans, reflecting their higher credit risk. At the same time, while the delinquency rate for conventional loans is still below the pre-pandemic level, the delinquency rates for FHA and VA loans have exceeded pre-pandemic levels. The delinquency rate for FHA loans is significantly above that seen since 2013 (barring a brief spike in 2017). The recent rise in the FHA delinquency rate is driven mainly by an increase in 30-day and 60-day delinquencies. As Fig. 11 shows, the seriously delinquent rate for FHA loans (i.e. 90-day +) is still declining from the pandemic peak and is at pre-pandemic levels.
Figure 10

Source: MBA’s Research Insights Quarterly Q2 2024 (p.16)
Figure 11
Source: FHA Annual Report to Congress Fiscal Year 2023 (p.14)
FHA Credit Performance – New Seriously Delinquent Borrowers Each Month
The FHA reports monthly on the performance of its portfolio. Along with various other items of information, it provides details on the number of new 90+ day delinquencies and, more importantly, on the reasons provided by the borrowers for being seriously delinquent (D90+). Figure 12 below reproduces Table 2 from the Aug 2024 performance report. As can be seen, along with the number of new D90+ delinquencies on the left, the share by reason for delinquency is reported in percentage terms. For example, in fiscal 2024 Q3 (calendar 2024 Q2), 24.82% of borrowers who were newly D90+ delinquent cited “Reduction of Income” as the reason for their delinquent status.
Figure 12

Source: FHA Single Family Loan Performance Trends (p.3)
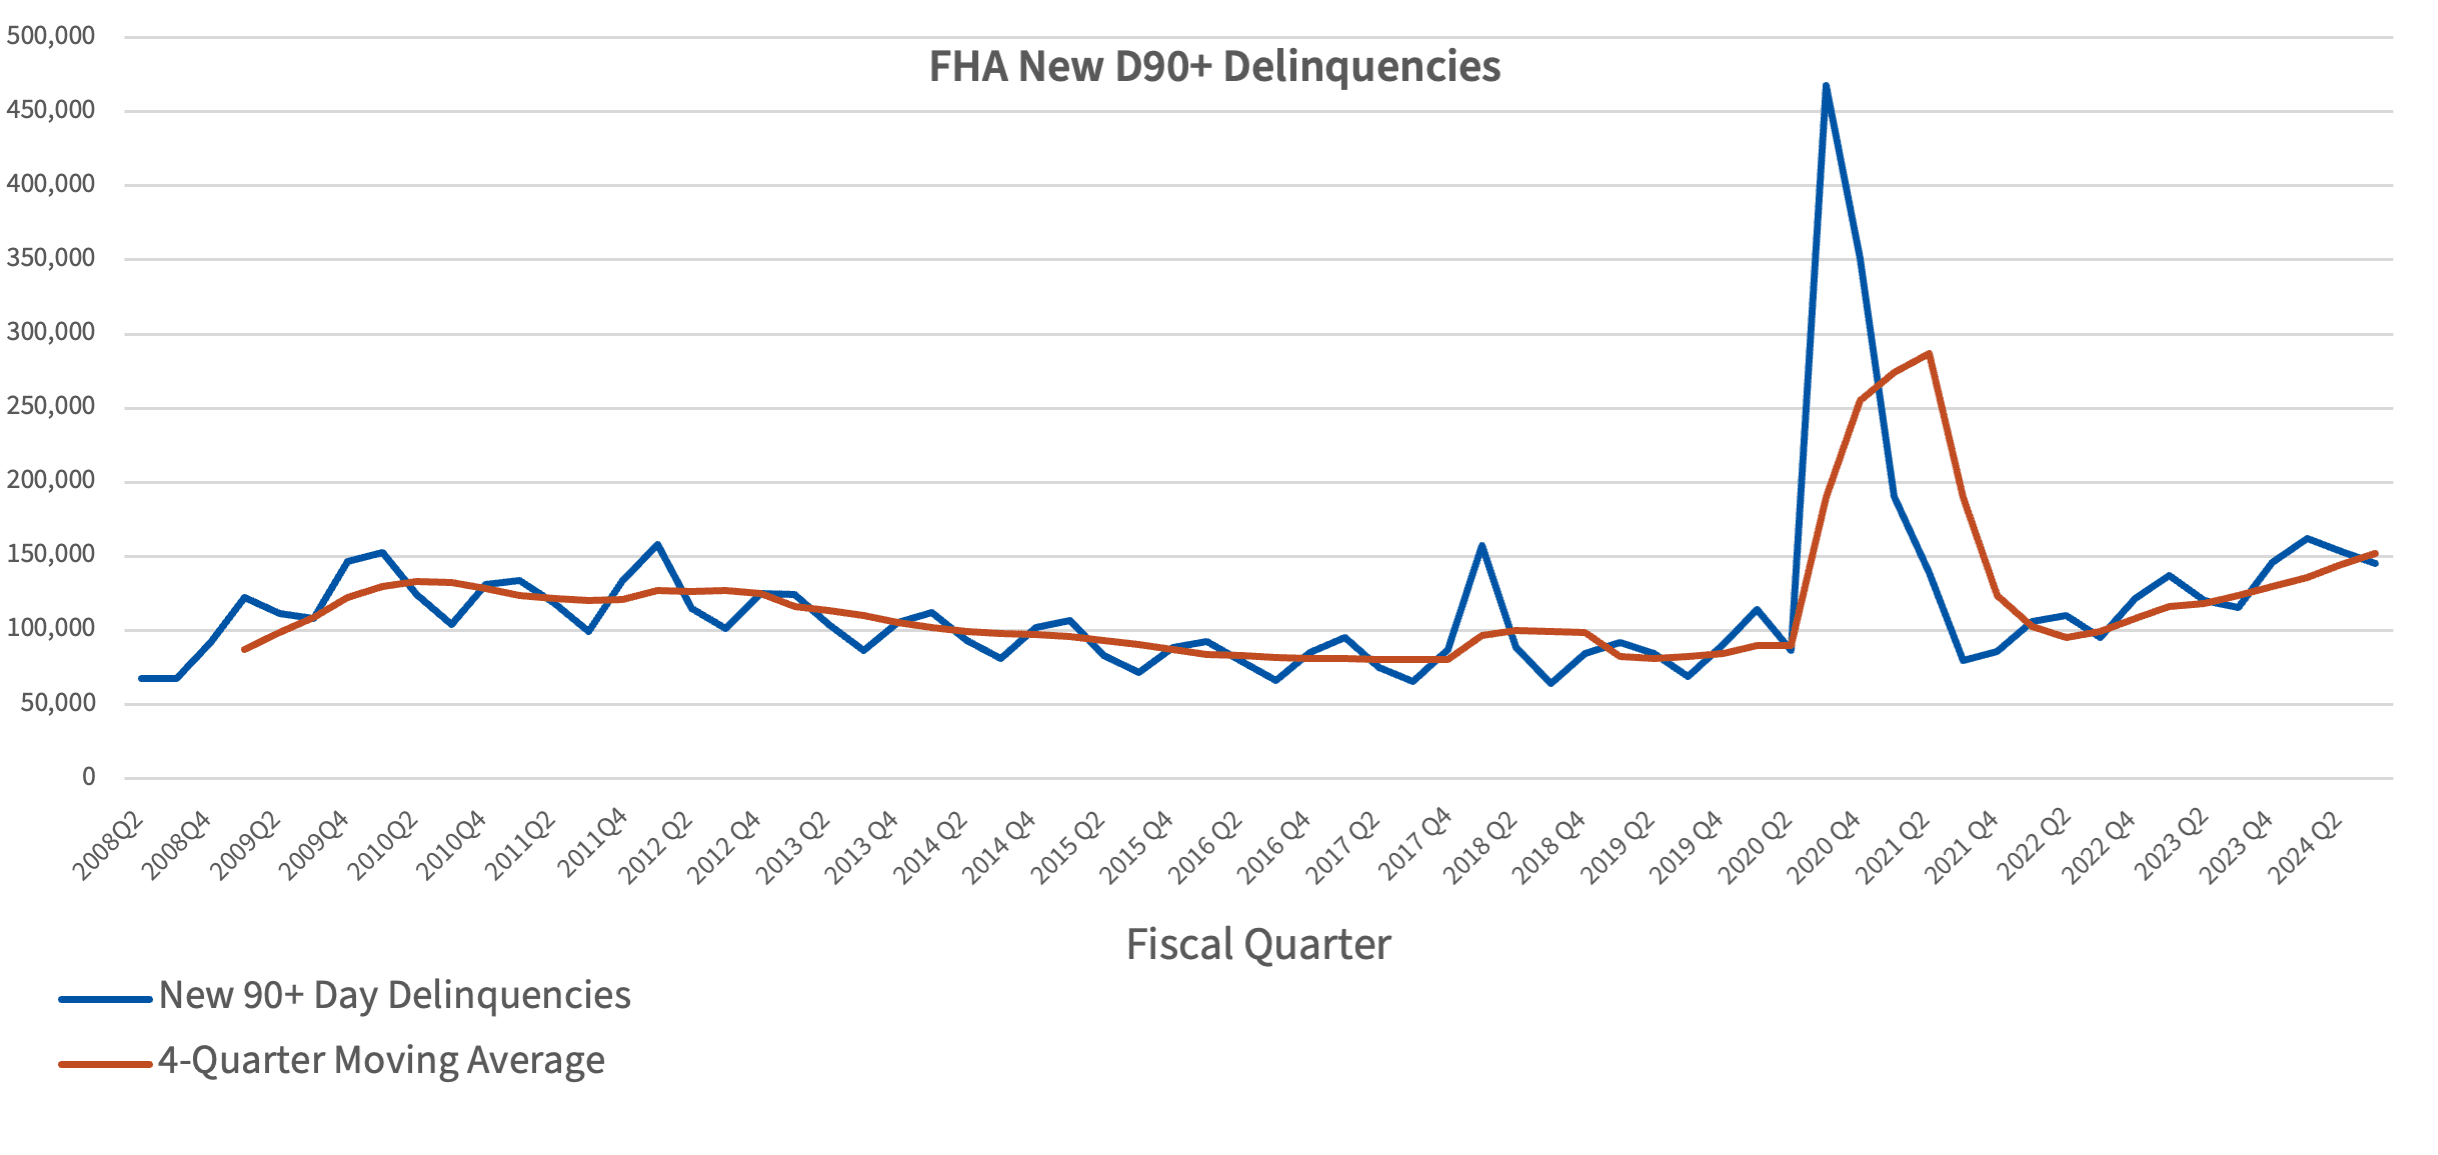
Figure 13 shows the number of new D90+ delinquencies in each quarter starting from 2008 onwards, as well as a 4-quarter moving average to smooth out the observed seasonality. The number of new D90+ delinquencies spiked up during the pandemic before coming down, and more recently, it has started rising. While the absolute numbers of new D90+ delinquencies in recent quarters are higher than those during the Global Financial Crisis (GFC), it should be noted that, per the data in Fig. 11, D90+ delinquency rates are considerably lower than those during the GFC.
Figure 13
Source: FHA Single Family Loan Performance Trends (2008-present)
Reasons for New D90+ Delinquencies
Before delving into more detail on the reasons for the new D90+, it is useful to note that, starting around 2016, the FHA started recording positive responses under the category “National Emergency” (see Fig. 14). The number of positive responses grew further in 2019 but, with the onset of the Covid pandemic, the percentage in this category skyrocketed to over 80% in 2020. Since then, it has been reducing and in the most recent quarter is around 13%. Essentially, during 2020-2022, most borrowers who were new entrants to D90+ status provided “National Emergency” as the reason. This also meant that the numbers in the other categories were likely artificially suppressed during the period 2020-2022 and, when reviewing the below analysis, it is probably best to exclude the 2020-2022 period for the other categories.
Figure 14

Source: FHA Single Family Loan Performance Trends (2008-present)
Three categories that are of particular interest are:
- Reduction of income
- Excessive obligations
- Unemployed
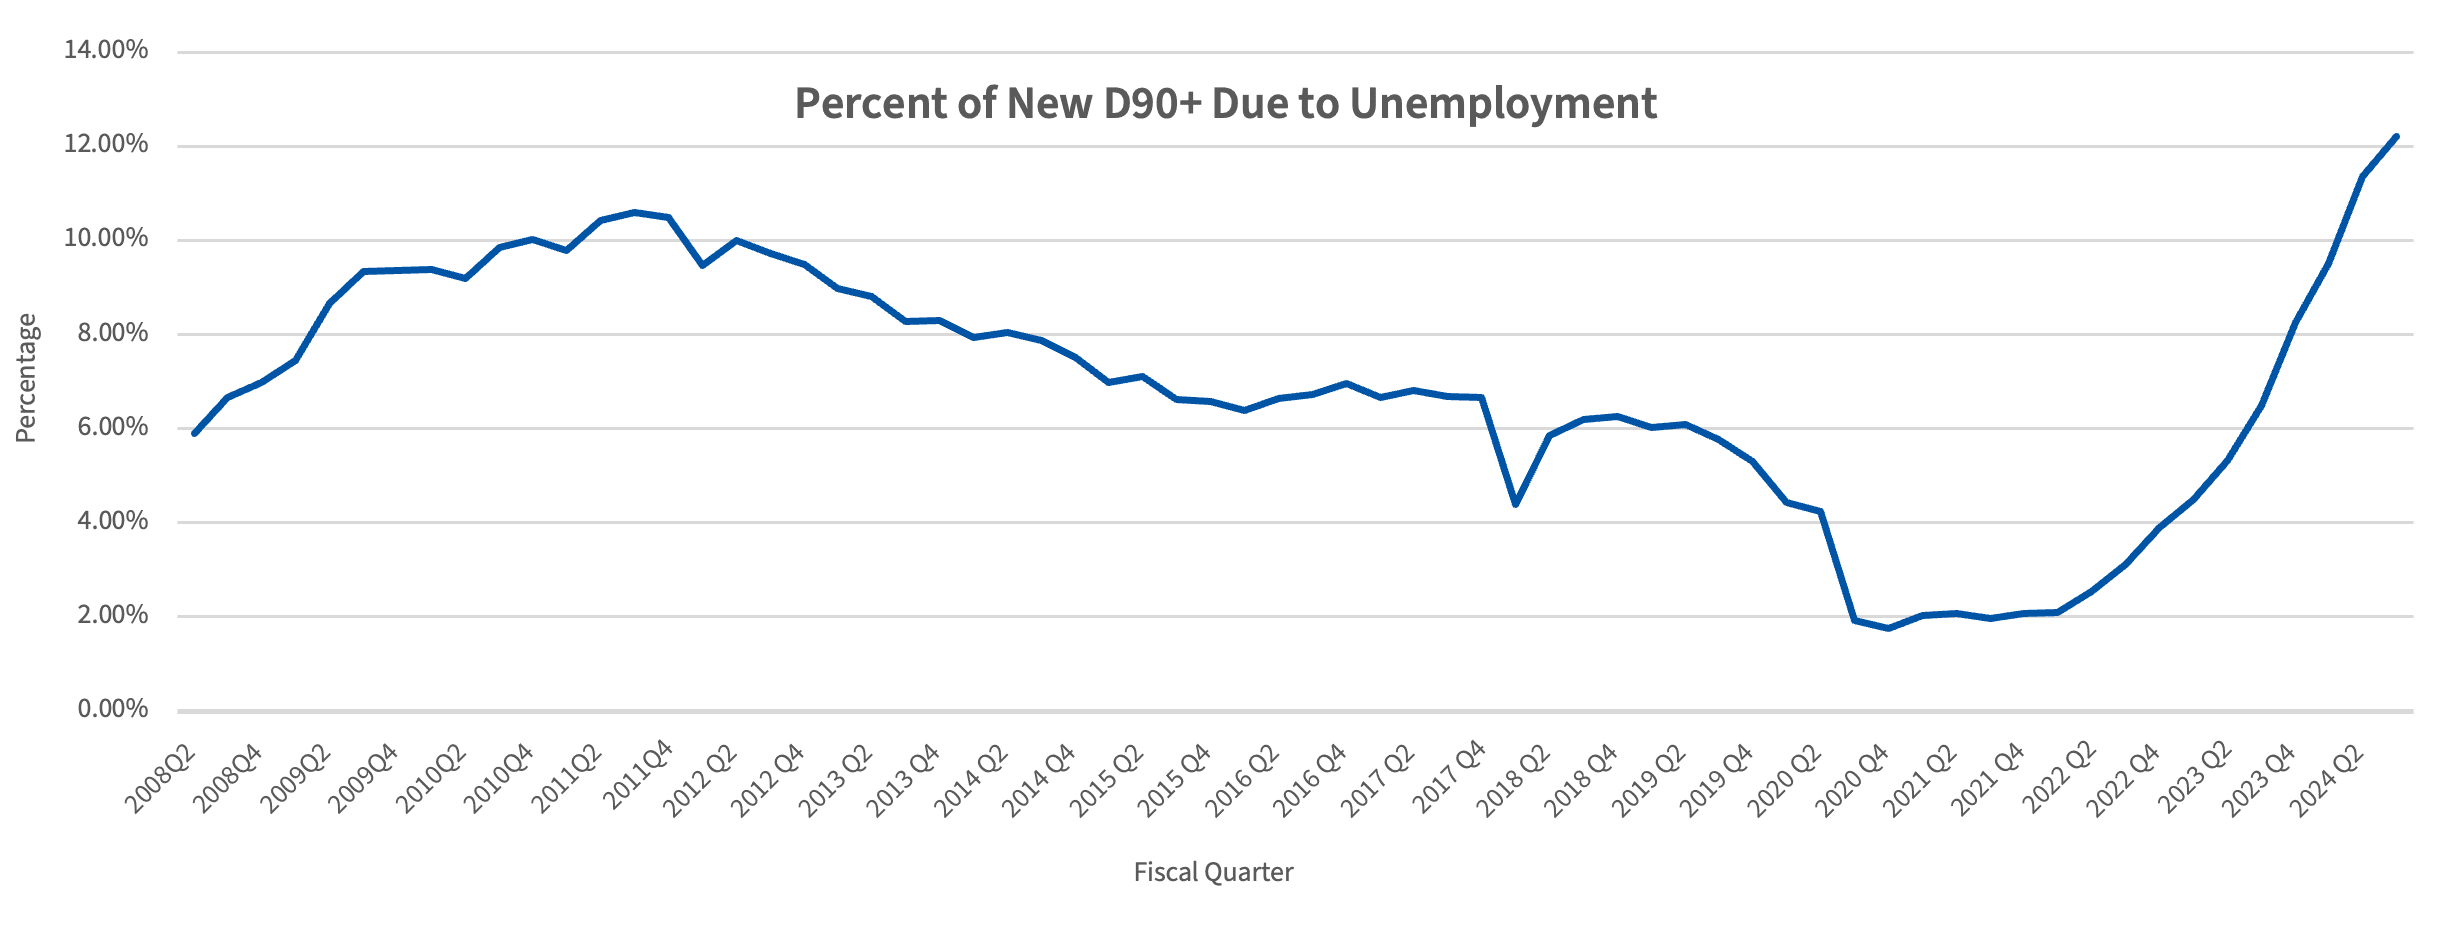
Fig. 15, Fig 16, and Fig 17 show the percentage of new D90+ borrowers providing each of the above categories, respectively, as their reason for becoming D90+.
From Figs 15-16, we notice that the percentages of new D90+ borrowers citing “Reduction of income” (RI) and “Excessive obligations” (EO) tend to move in opposite directions relative to each other. The RI % rose during the GFC to around 40% and, after that, trended down to around 30% just prior to the pandemic. Post-pandemic, its level has returned to around 25%, which is still below the pre-pandemic level. On the other hand, the EO % was 25% at the start of the GFC and dropped to around 14% by the end of the GFC. After that, it rose to around 23% by the start of the pandemic. Post-pandemic, the level is still returning to a higher level and, most recently, is around 18%, which is still well below what it was at the start of the pandemic.
Figure 15

Source: FHA Single Family Loan Performance Trends (2008-present)
Figure 16

Source: FHA Single Family Loan Performance Trends (2008-present)
The percentage of new D90+ borrowers citing “Unemployment” (U) rose from 6% at the start of the GFC to nearly 11% by the end of the GFC. After that, it declined to around 4.5% just before the start of the pandemic. However, what is really striking is that the U % has risen rapidly post-pandemic to a level even higher than that seen during the GFC with a particularly steep climb – from 6.5 % in fiscal 2023 Q3 to 12.2 % in fiscal 2024 Q3 – over the last year. This sharp increase in U % has occurred at a time when unemployment rates have stayed quite low by historical standards, even while rising from 3.4% in April 2023 to 4.1% in Sept 2024.
Figure 17
Source: FHA Single Family Loan Performance Trends (2008-present)
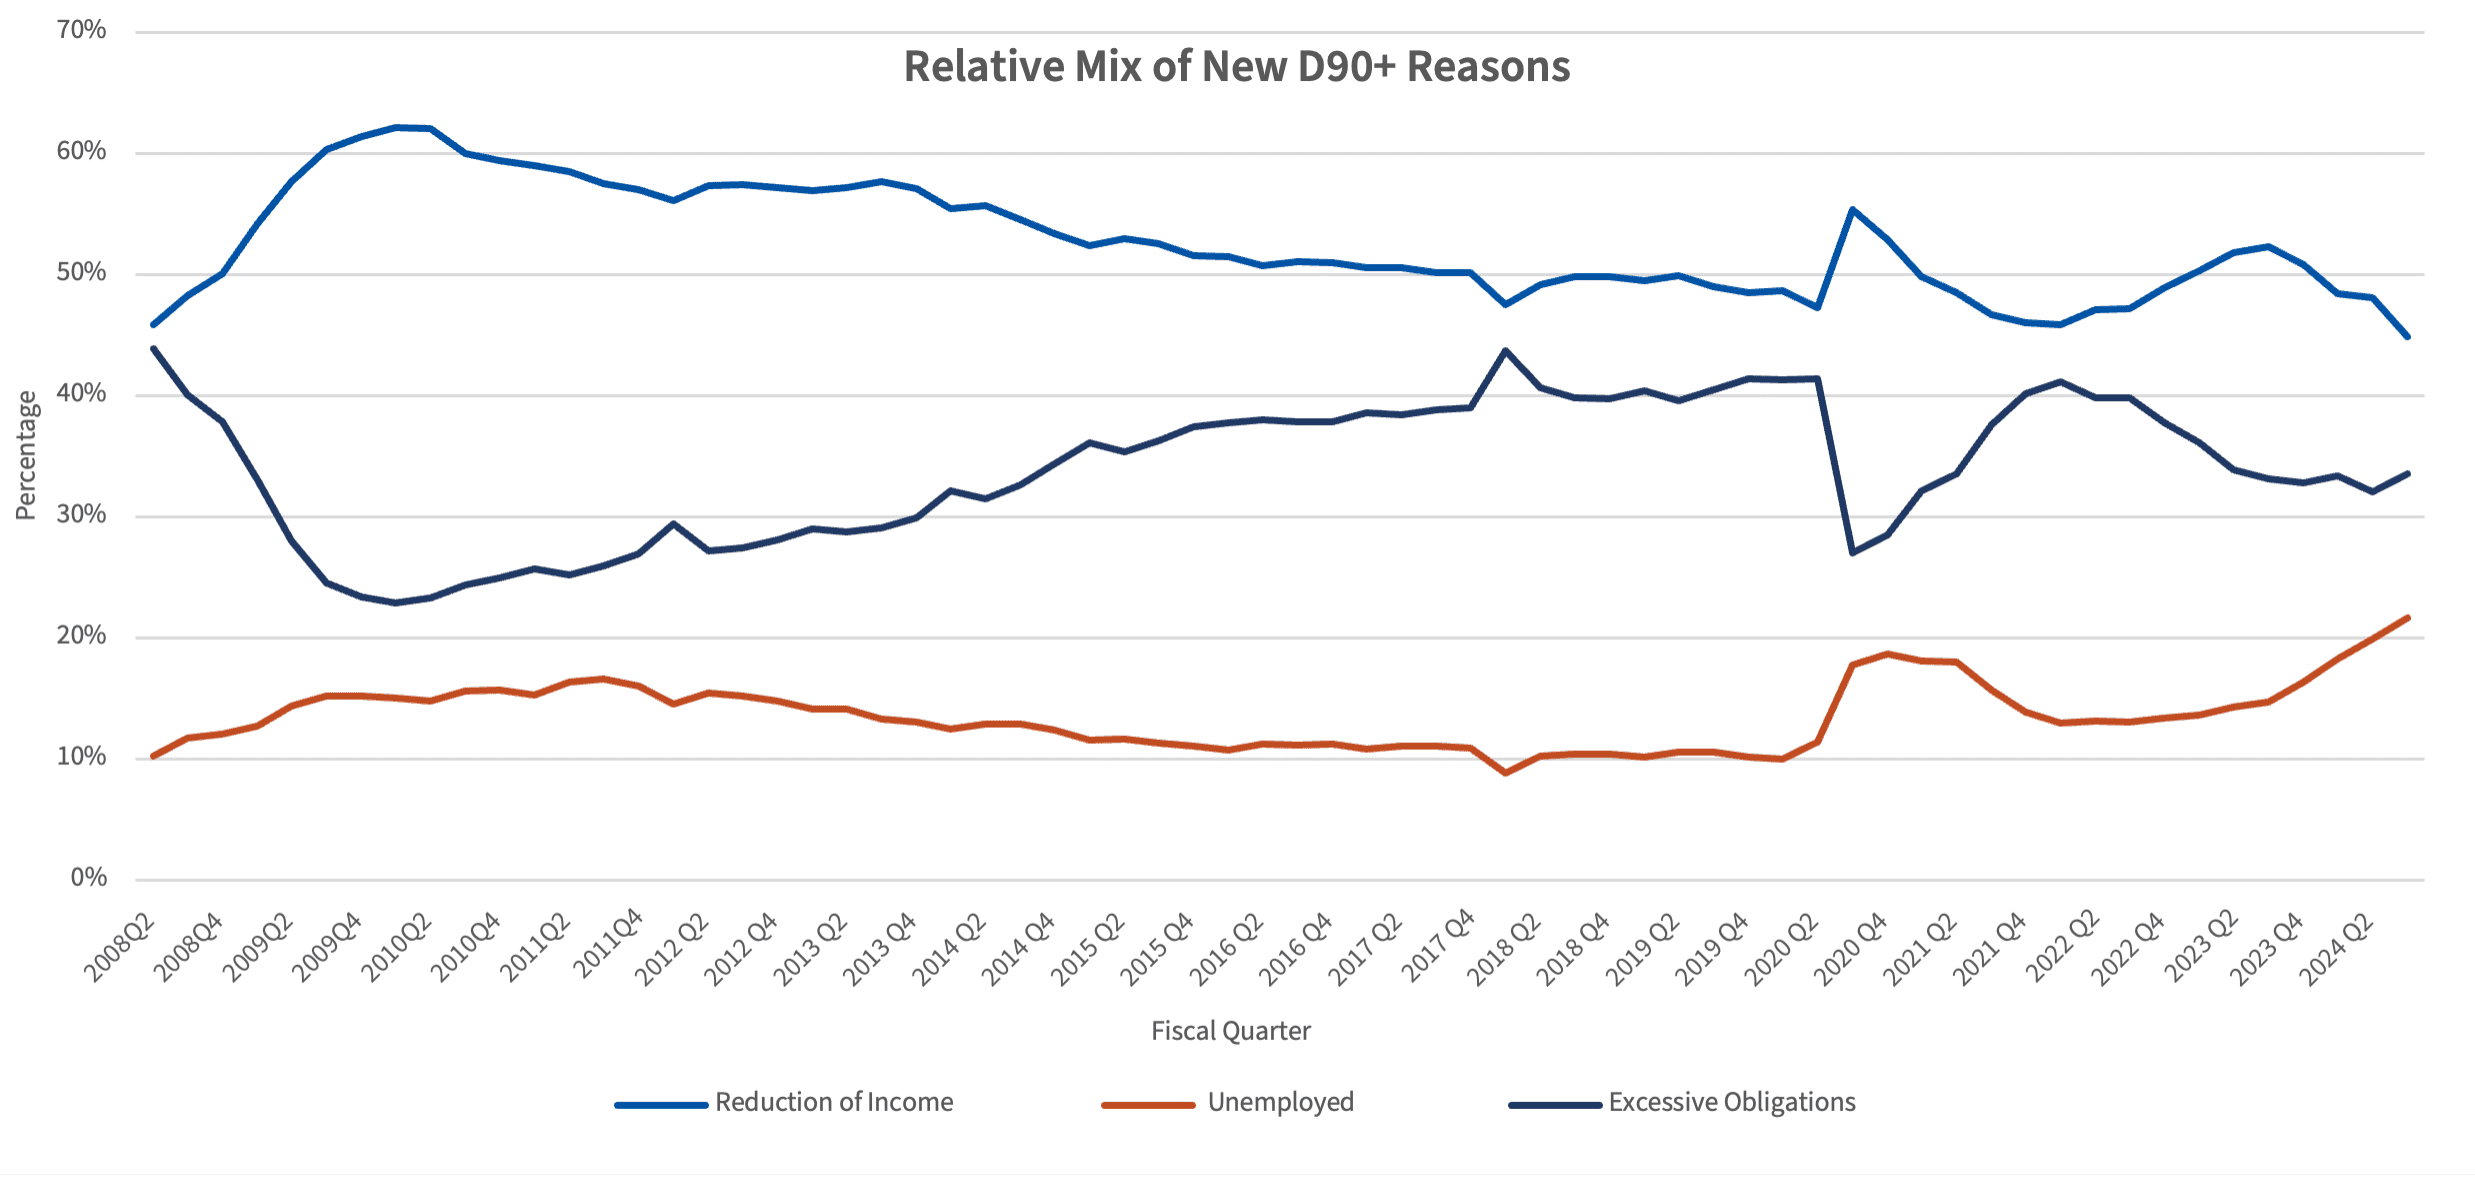
Fig. 18 shows the relative mix of just the RI, EO and U percentages such that they sum to 100%. The inversely correlated movements of the RI and EO percentages are more clear. At the same time, the recent rise in the U % is unmistakable and quite striking. As noted previously, the numbers during the 2020-2022 time period are best ignored due to the overwhelming percentage of borrowers citing “National Emergency” as the reason for their becoming D90+.
Figure 18
Source: FHA Single Family Loan Performance Trends (2008-present)
What Could Cause the Large and Rapid Increase in Unemployment (U) %?
In this section, we explore some possible reasons for the large and rapid increase in the U %. At the outset, it is important to recap that the U % is the percentage of those FHA borrowers, newly entering D90+ status, who say that the reason that they are in D90+ status is “Unemployment.” Since such borrowers were more likely to have had a job (in order to pass an underwriting screen) when they obtained an FHA loan, it implies that these borrowers most likely lost their jobs recently and that the resulting financial shock has caused them to miss multiple mortgage payments and become D90+. Given this, the U % can be thought of as a form of the unemployment rate for that particular new D90+ cohort.
The connection between the unemployment rate of this cohort and that of all current FHA borrowers can be understood by breaking out all current FHA borrowers into two groups – those FHA borrowers who are currently in D90+ status (Group A) and those FHA borrowers who aren’t (Group B). The cohort of new entrants into D90+ status will obviously fall within Group A. The unemployment rate across all FHA borrowers is then a weighted average of the unemployment rates of Groups A and B.
From this, it can be seen that the unemployment rate of all FHA borrowers is related to the U % of recent new D90+ cohorts (since the recent new D90+ cohorts are part of Group A, which, in turn, is part of the portfolio of all FHA borrowers,). We now consider some factors likely to impact the unemployment rate of all FHA borrowers to see if they may help explain the large and rapid increase in U %.
As noted in section 2, including in Fig. 9, FHA borrowers tend to have lower incomes than average. While the Bureau of Labor Statistics (BLS) breaks out unemployment rates by educational attainment and not by income, the BLS also finds (as do other studies) that workers with higher education generally tend to earn more. With that in mind, it is useful to look at the changes in unemployment rates over the past year, including for workers with different levels of educational attainment.
Fig. 19 shows the top part of Summary Table A from the BLS’s employment report for September 2024. Over the 12 months from Sept 2023 to Sept 2024, the number of unemployed workers increased by about 487K (from 6.347 million to 6.834 million) while, at the same time, the unemployment rate went up by 0.3 % (from 3.8% to 4.1%). Table A-4 from the same BLS report for Sept 2024 provides a breakout of unemployment by educational status. From Table A-4, we see that, over the same 12-month period from Sept 2023 to Sept 2024, the number of unemployed with at least a bachelor’s degree went up by 120K while that for those workers with a lower level of educational attainment went up by 223K. In other words, the increase in unemployed workers without a college degree, who are also likely to be lower-earning workers, was greater than the corresponding increase for workers with a college degree over Sept 2023 – Sept 2024.
Figure 19
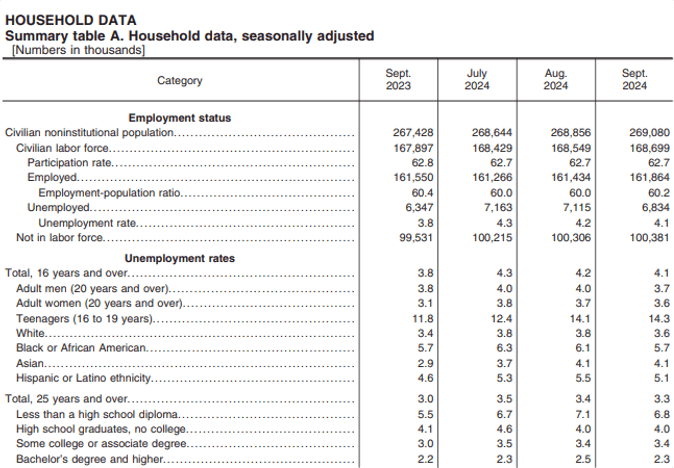
Source: BLS news release Oct 4, 2024, Summary table A
It has been argued, however, that the recent increase in unemployed workers is less due to layoffs and more due to the large number of new entrants into the workforce, with immigration being a key factor, who have not yet found jobs. Since the rapid rise in U % is due to FHA borrowers who have likely lost their jobs over the past year, it is more helpful to identify the rise in people who have lost jobs.
Fig. 20 shows the bottom part of Summary Table A from the BLS’s employment report for September 2024 and breaks down further the reason for unemployment. From Sept 2023 to Sept 2024, the number of workers who had lost their jobs has increased by around 364K workers (in fact, it could be even higher since some of the workers who had lost jobs earlier may have found another by Sept 2024). By comparison, the new entrants have increased only by around 76K over the same period. The other two categories (job leavers and reentrants) show an increase of only around 43K. It is clear from this data that the vast majority (around 3/4th) of the increase in unemployed workers is due to an increase in workers who have lost their jobs.
Figure 20
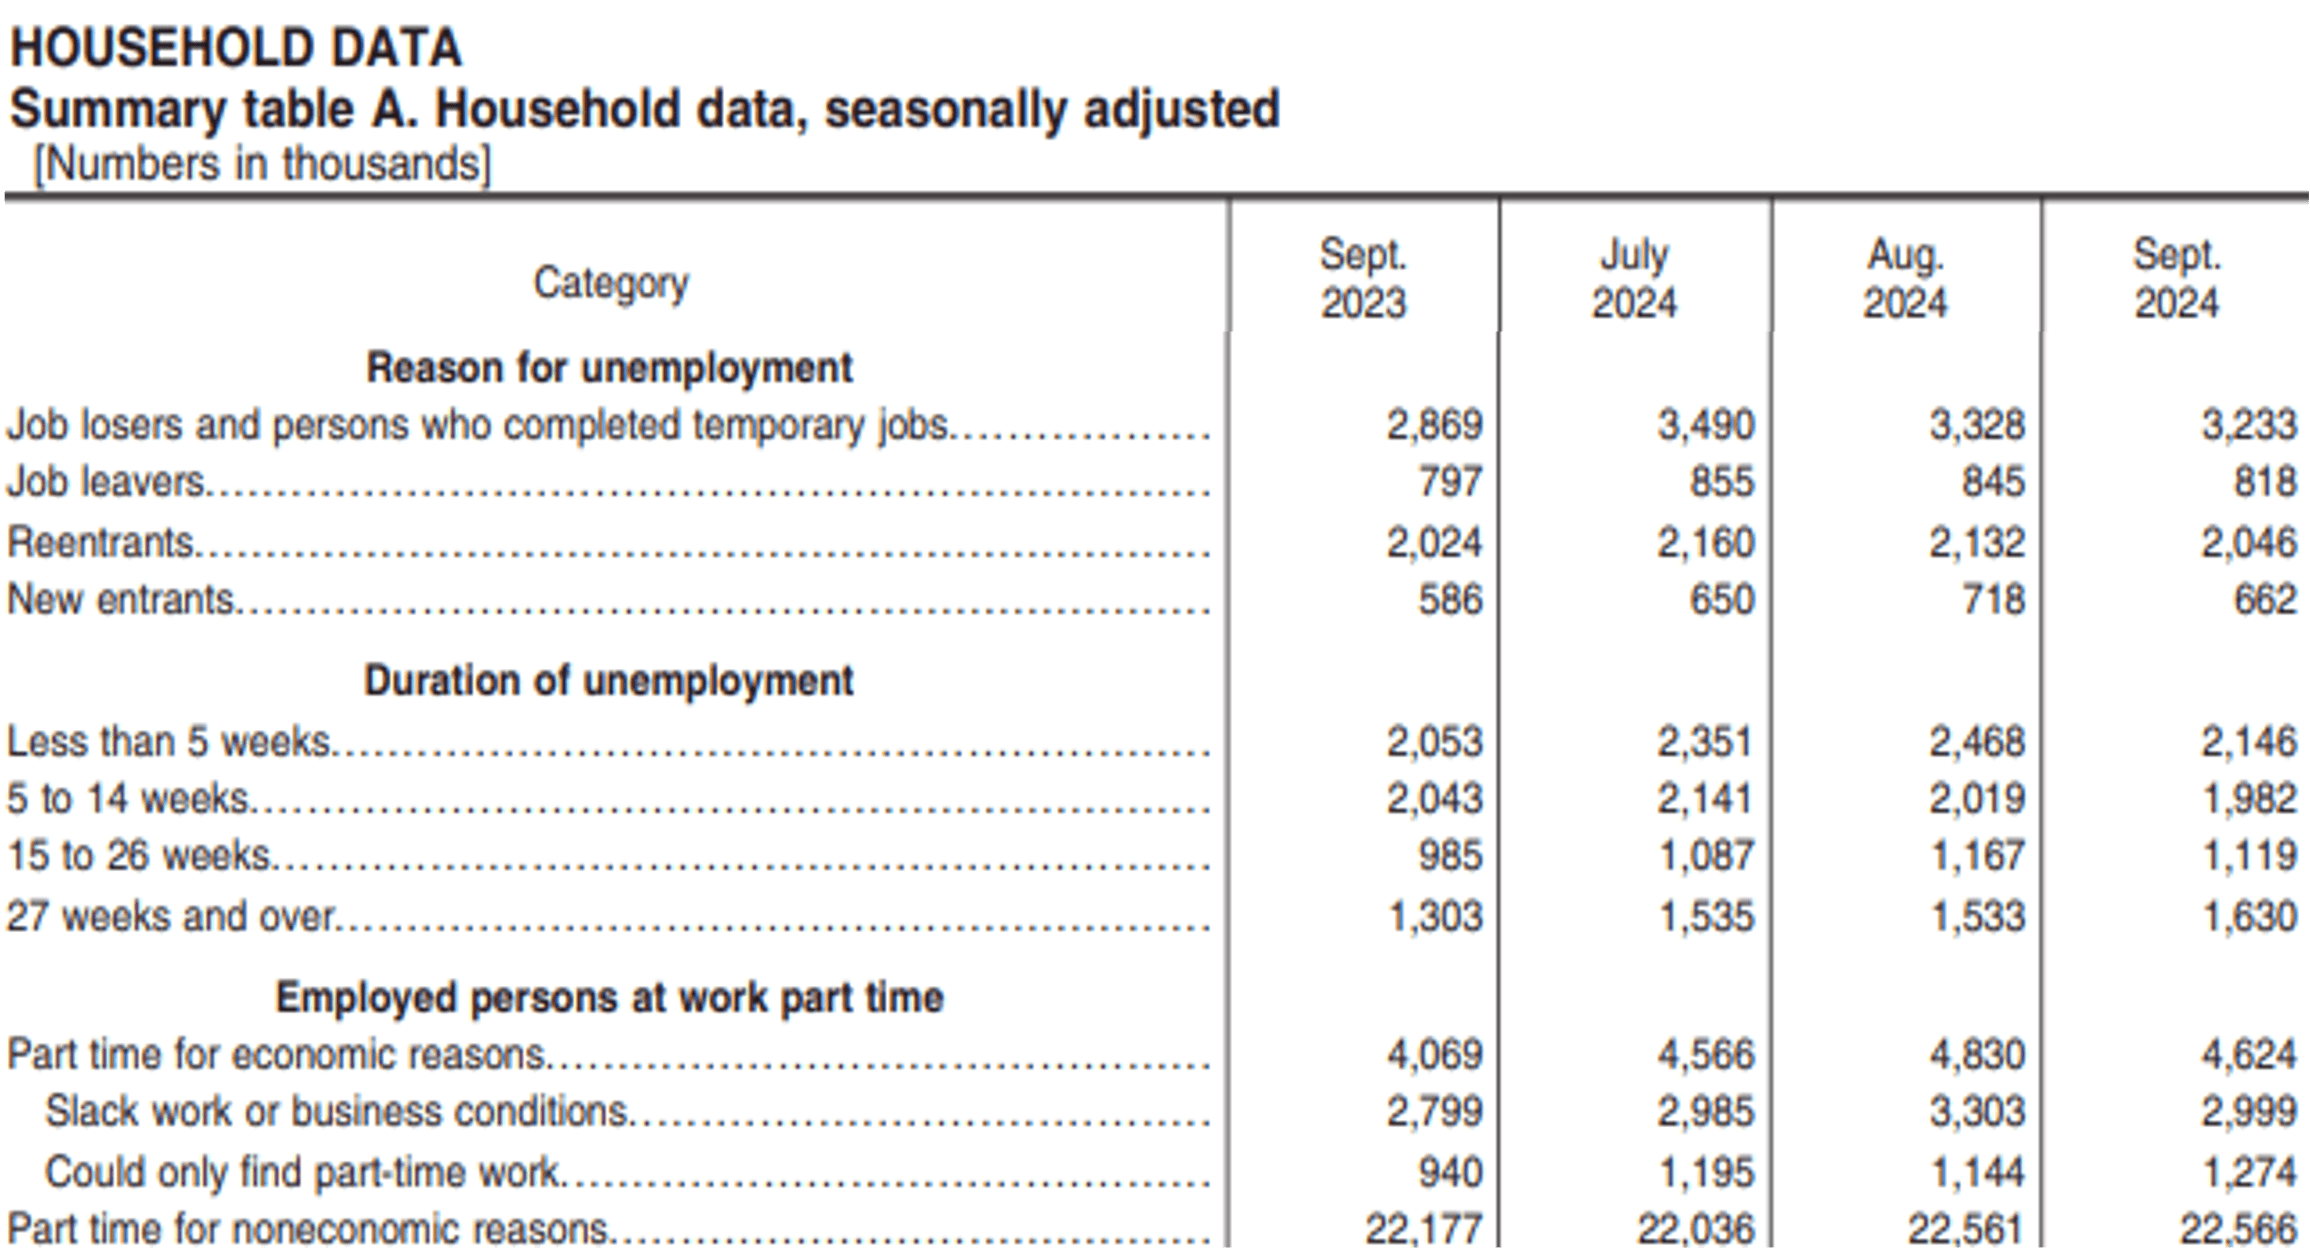
Source: BLS news release Oct 4, 2024, Summary table A
Fig. 20 also shows that most of the increase in unemployed workers (461K) over the last 12 months has been among workers who have been unemployed for at least 15 weeks (134K for 15 to 26 weeks + 327K for 27 weeks and over).
When we compare this picture with that from the prior 12-month period (i.e., from Sept 2002 to Sept 2023), we note several similarities in the unemployment data over the two consecutive 12-month periods
- The unemployment rate also increased by 0.3% (from 3.5% to 3.8%) from Sept 2022 – Sept 2023
- The increase in the number of unemployed during Sept 2022 – Sept 2023 was also largely driven by workers who lost jobs (328K out of an increase of 590K in the number of unemployed workers), though to a lesser extent than in the following 12-month period.
At the same time, there are some significant differences as well.
- During Sept 2022 – Sept 2023 (from Table A-4 of the Sept 2023 report), the number of unemployed with at least a bachelor’s degree went up by 232K while that for workers with a lower level of educational attainment went up by 236K, i.e. the increase in unemployed workers was comparable for both groups, unlike during Sept 2023 – Sept 2024 when the less educated (and, therefore, lower income) saw a considerably greater increase
- The increase in the number of workers unemployed for over 15 weeks is around 298K over the earlier period as compared to 461K over the later period
The picture that emerges from this is that during Sept 2023 – Sept 2024, when compared with Sept 2022 – Sept 2023, a greater share of the increase in unemployed workers
- has occurred among lower-income workers
- has been due to job loss (as opposed to new entrants not finding jobs)
- has been among workers who have been unemployed for at least 15 weeks, and further, of these, most have been unemployed for at least 27 weeks
To summarize, the BLS job reports indicate a growing number of lower-income workers losing their jobs in the past 12 months and, further, remaining unemployed for a longer duration. This picture is consistent with the recent pattern of increase in U %. Out of around 607K borrowers newly entering D90+ status over the Jul 2023 – June 2024 time period, nearly 63K have attributed their reason as “Unemployment” (Fig. 12). Since mortgage payments are usually accorded a high priority in most households and since it takes time from the borrowers experiencing the financial shock of a job loss to their missing 3 or more mortgage payments, this rise in U % is also consistent with the jobs data showing, increasingly, that more unemployed workers are lower income and are experiencing longer periods of unemployment.
Implications
There are a couple of implications of the above analysis, both somewhat sobering. First of all, the classic pattern of mortgage default is that some fraction of borrowers who have negative equity and experience a financial shock such as job loss then default. An important trigger here is a large financial shock that does not quickly reverse itself, such as job loss followed by an extended period of unemployment. In that context, a borrower who enters D90+ status due to a job loss generally faces a more difficult situation due to the magnitude of the financial shock. If, in addition, their state of unemployment persists and they have negative equity due to falling prices, as seen in some parts of the US today, this is more likely to cause the borrower to default on their mortgage. In other words, the fact that a greater number of FHA borrowers entering serious delinquency are attributing their status to unemployment is concerning, as unemployment for an extended period is usually a bigger hole to climb out of from the perspective of default, as was seen from the mortgage default experience during the GFC.
Second, as discussed earlier, FHA borrowers have worse credit quality, lower income, and higher LTVs than conventional borrowers, and for this reason, their performance is often viewed as the “canary in the coal mine.” This means that any signs of deteriorating credit performance could be a harbinger of what GSEs and other financial institutions could expect with regard to conventional borrowers, who form a much bigger part of the mortgage market.
Conclusion
The above analysis has tried to relate the sharp uptick in the percentage of new D90+ FHA borrowers reporting “Unemployment” as their reason for being in the D90+ status with the US job market, and the patterns seen in the job market are consistent with what the FHA borrowers are reporting. This is an important area that needs to be watched closely, given how closely intertwined housing performance is with the broader economy and because the FHA is often a leading indicator for the rest of the mortgage market.


