


SUMMARY
We conducted a study in Dec 2023 that revealed a trend showing US states with lower growth in house prices were more likely to also have experienced higher increases in unemployment rates. In past housing downturns, states that experienced deeper declines in house prices generally also experienced higher increases in unemployment. Therefore, any emerging signs of such a relationship could be an early indicator of a housing downturn that is also accompanied by a recession.
We have since updated the study with more recent data and the above relationship between house prices and unemployment rates is even stronger now.
APPROACH
Rather than look for a correlation between house price appreciation (HPA) and increases in the unemployment rate (UR) across all 50 states plus DC, we narrowed the focus to two subsets – one that includes states with the lowest levels of HPA and another that includes states that have the highest increases in unemployment rate. Our goal is to see if there is a disproportionate share of the members of either subset in the other when compared to their share of the total population.
If there is such a disproportionate share, this is evidence of the above-mentioned relationship between house prices and unemployment rates. Further, the more disproportionate the share, the stronger the relationship.
HIGHLIGHTS
In Figure 1 below, there are 13 states with house price appreciation <= 5% since Q4 2022, which is 25% (= 13/51) of all states. Similarly, there are 14 states with an unemployment rate increase >= 0.7% since hitting bottom over the preceding year, which is 27% (=14/51) of all states.
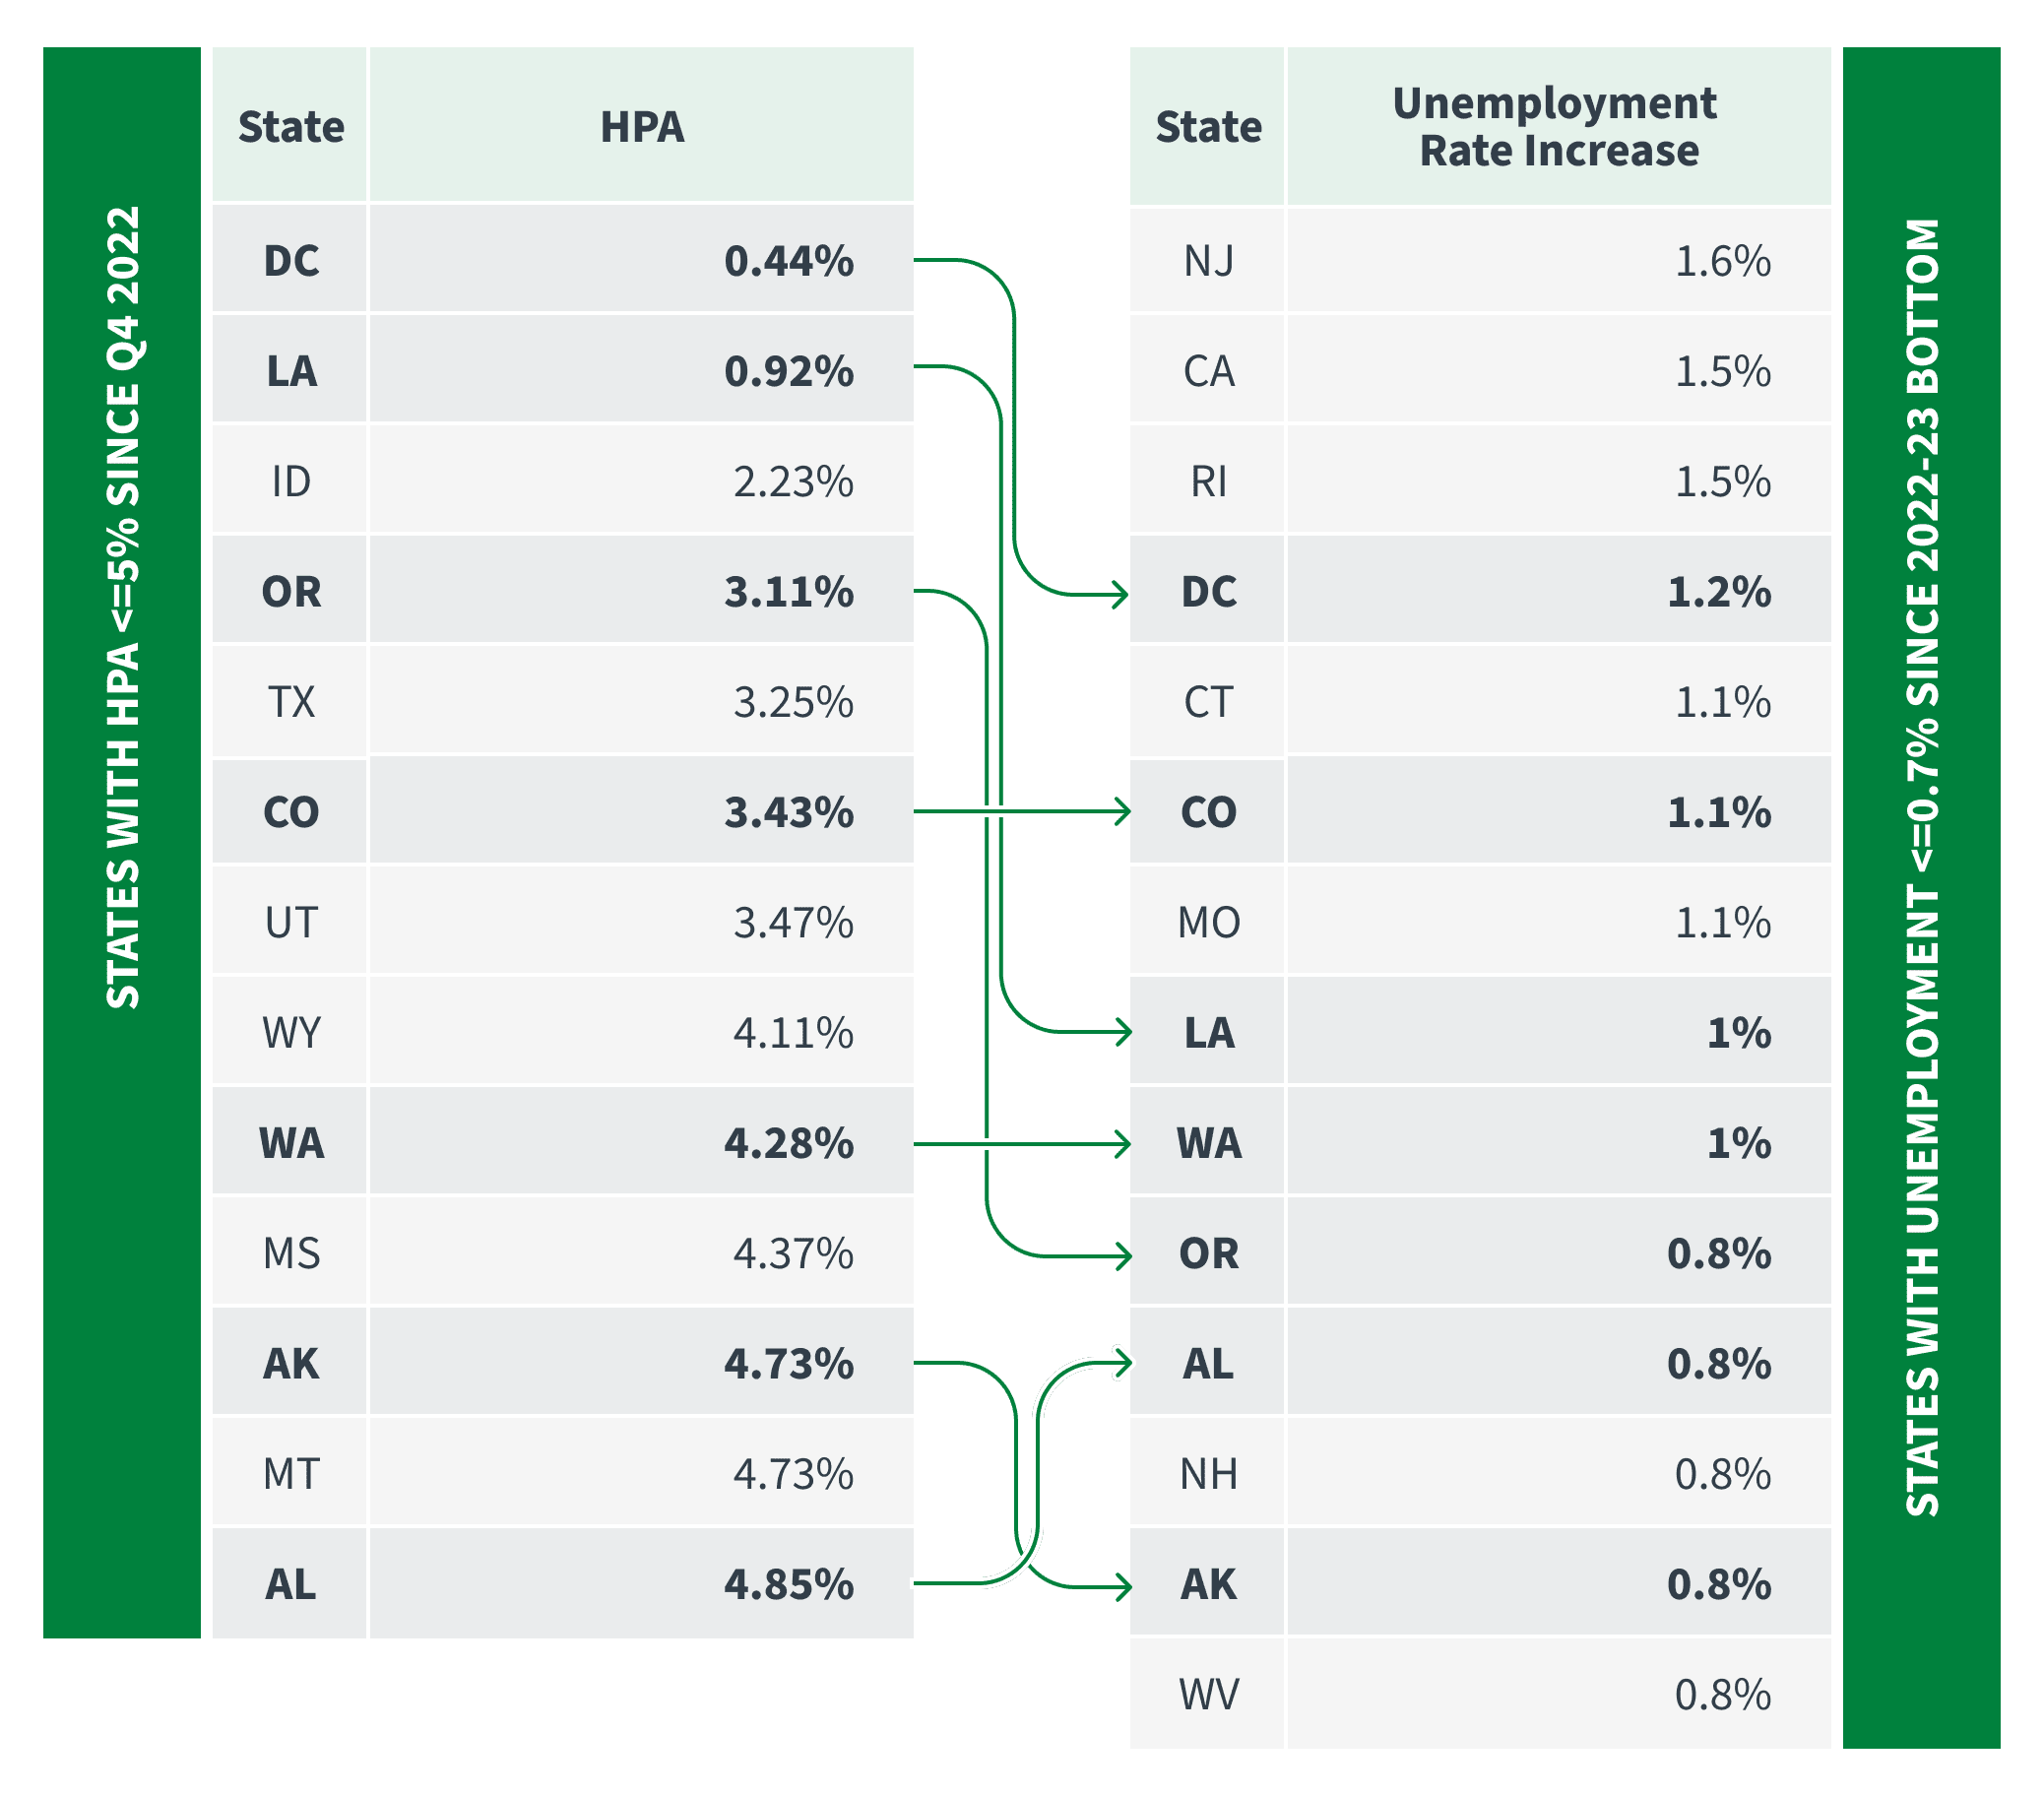 Figure 1 States with HPA Decreases (<=5%) vs UR Increase (>=0.7%)
Source: FHFA all transactions house price index, BLS Geographic Information
Even though the 13 states with HPA <= 5% make up only 25% of all states, they make up 50% (= 7/14) of the states that have UR increase >= 0.7% I.E. they are 2X (=50%/25%) as likely to be present in the UR increase subset. Similarly, even though the 14 states with UR increase >= 0.7% make up only 27% of all states, they make up 54% (= 7/13) of the states that have HPA <= 5% I.E. these states are also 2X (= 54%/27%) as likely to be present in the low HPA subset.
There is, therefore, a disproportionate share of states belonging to the low HPA in the high UR increase subset and vice versa.
In the prior study, there were 31% and 39% respectively of all states plus DC that had 1-year HPA <= 4% and UR increase >= 0.4%. However, states from the low HPA subset made up 45% of the high UR increase subset I.E. they were 1.45X (=45%/31%) more likely to be present in the UR increase subset. Similarly, states from the high UR increase subset made up 56% of the low HPA subset I.E. they were 1.44X (=56%/39%) more likely to be present in the low HPA subset.
When comparing the results of the current study to the prior study, we note that the extent of disproportionality has increased considerably (2X/2X vs 1.44X/1.45X) since the last time.
In summary, there is now clearer and more compelling evidence that states where house price growth is slower or is slowing down are more likely to also be states with higher increases in unemployment. This is, therefore, a stronger early warning indicator for a housing downturn of the kind that was experienced in the past (mid 80’s in the Southwest, early 90s in California and Northeast, 2007 nationally) and that was also accompanied by a recession (regional or national).